IRR vs MOIC: How Private Equity Scores a Deal
MOIC is how many times the cash came back. IRR is that multiple with a clock. A 2.0x in three years is about 26 percent. The same 2.0x in seven years is about 10 percent.
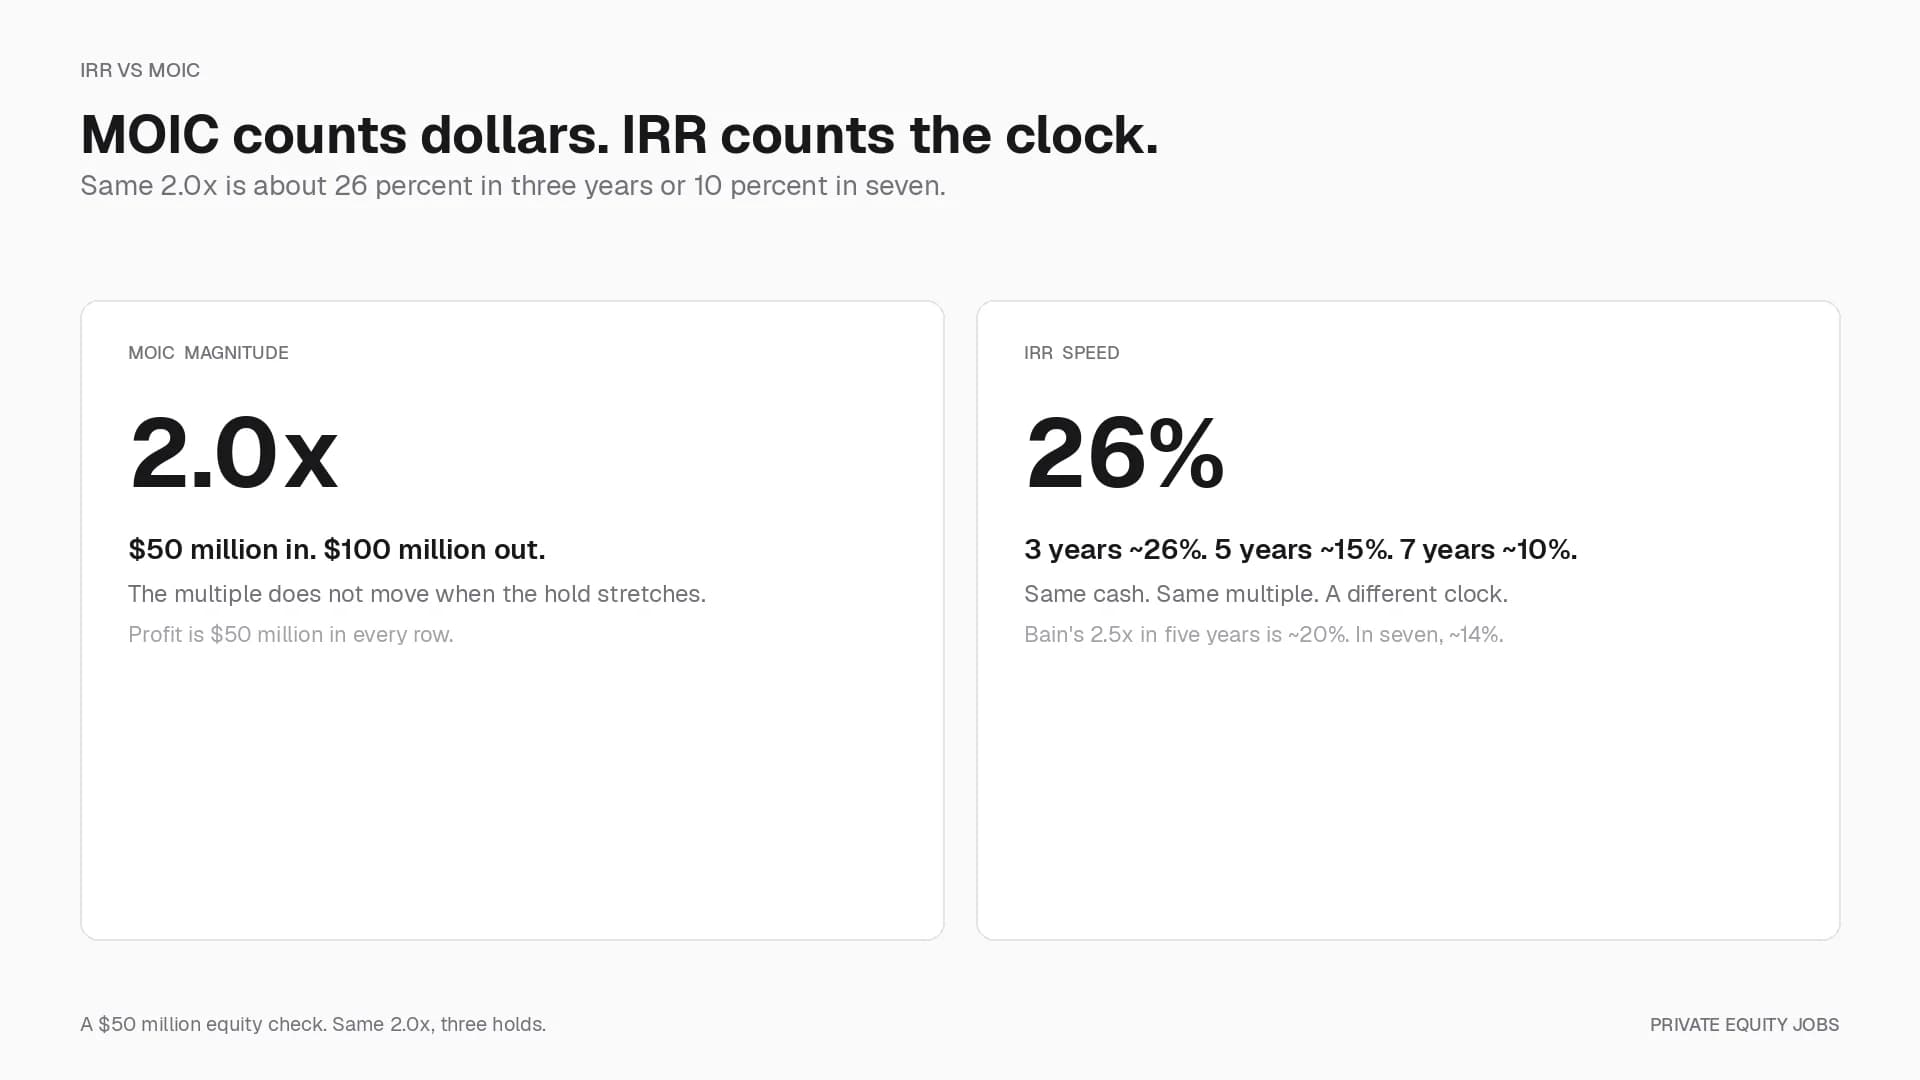
IRR is the annualized rate on the cash. MOIC is the multiple: how many times the equity came back. A deal that turns $50 million of equity into $100 million is a 2.0x MOIC whether it took three years or seven. The IRR is not the same number. Three years is about 26 percent. Seven years is about 10 percent.
Private equity quotes both because each number leaves something out. A deal that turns $10 million into $13 million in a year can show a high IRR and still be a small gain. A deal that turns $10 million into $30 million over a long hold can look strong on the multiple and ordinary once the years are counted. Limited partners look at the pair, then ask a third question neither metric answers: how much of that value is cash already in hand.
What MOIC measures
Multiple on invested capital is total value divided by capital invested. Total value is cash already returned plus whatever is still marked on the books. Invested capital is the equity cheque, or, at fund level, the capital that has been paid in.
MOIC = (realized value + unrealized value) / invested capital
A 2.0x means each dollar put in is now worth two dollars. A 1.0x is money back with no gain. Below 1.0x is a loss. The ratio does not care when the dollars moved. A dividend in year two and a sale in year five sit in the same numerator as a single cheque at exit.
Sponsors also say multiple of money, equity multiple, or cash-on-cash. At the deal, those labels usually mean the same ratio. At the fund, the related measures have their own names: DPI for cash distributed, RVPI for residual value, and TVPI for the two added together. MOIC and TVPI match when every dollar of committed capital has been paid in. They do not match in the middle of the investment period, when only part of the commitment has been called.
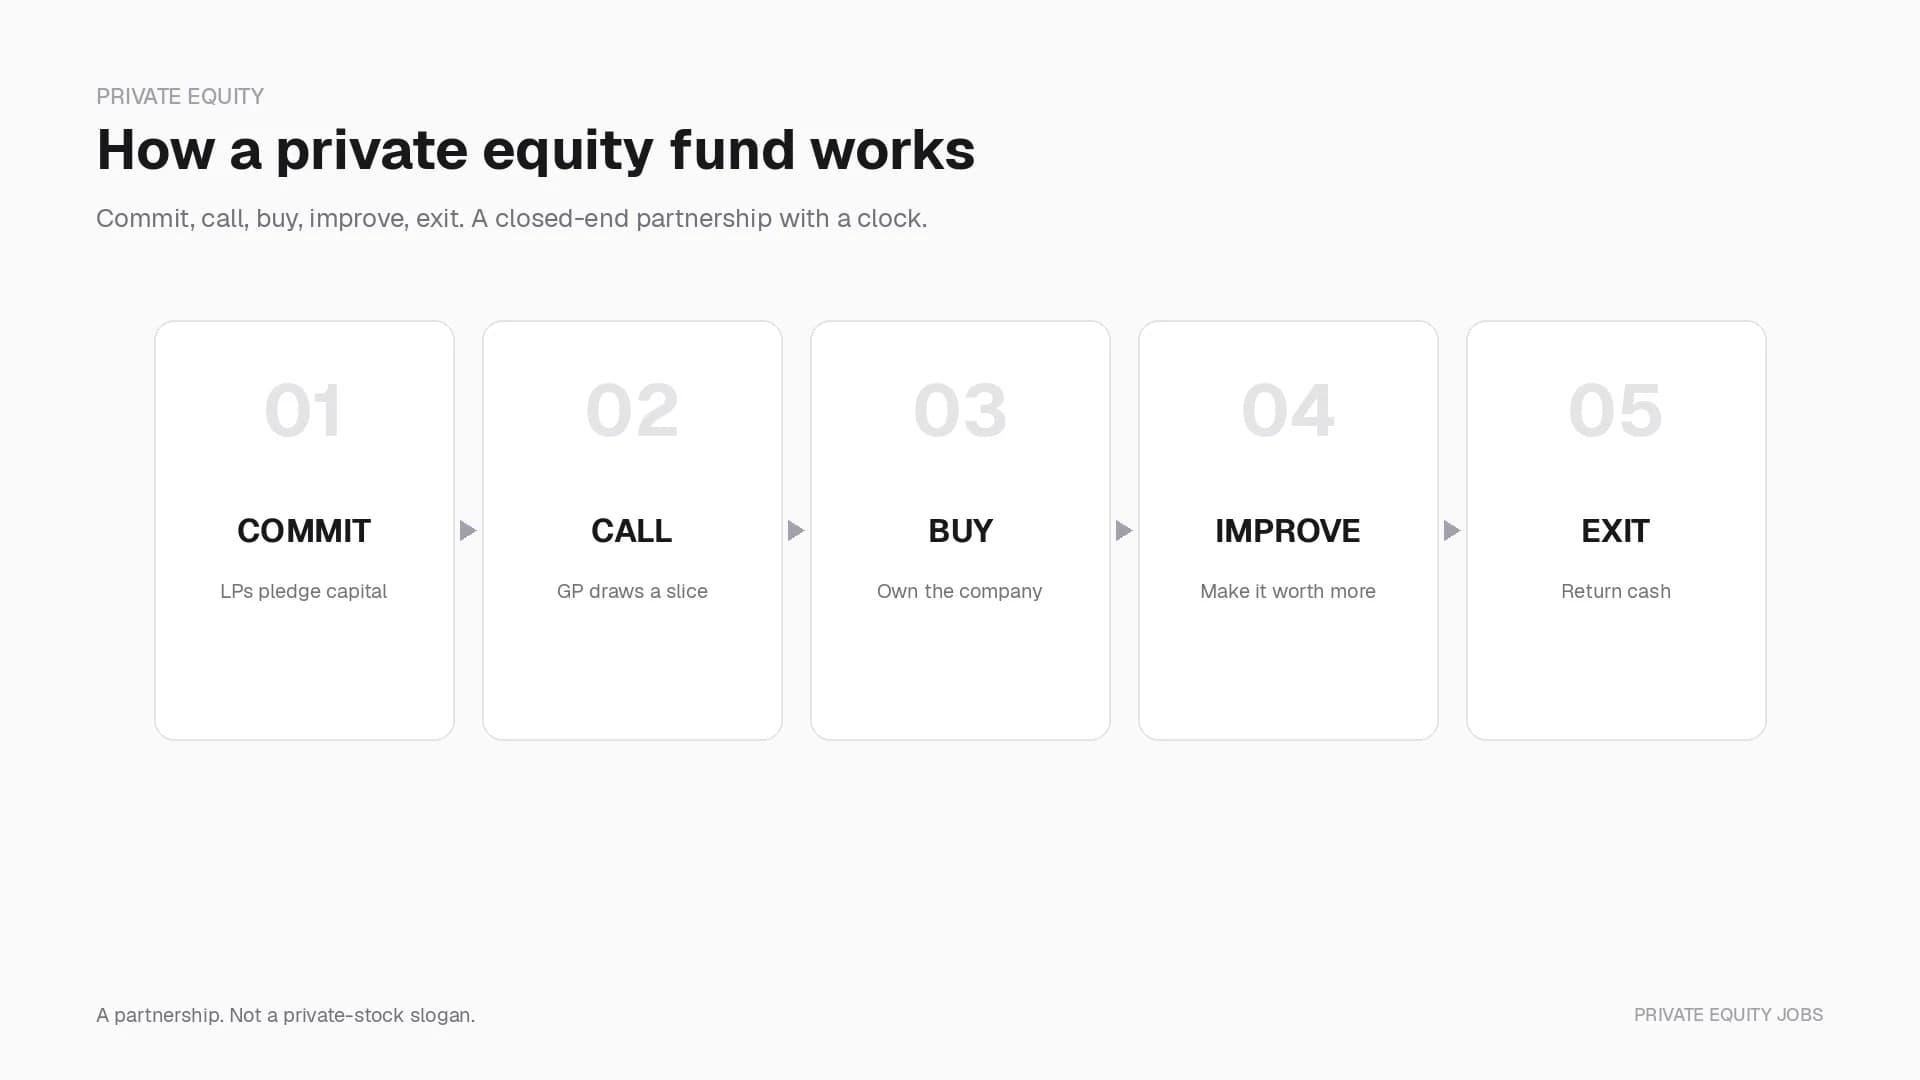
The close that produces these cash flows is a leveraged buyout.
What IRR measures
Internal rate of return is the annualized rate that sets the net present value of the cash flows to zero. Money out is negative. Money in (distributions, and residual value at the measurement date) is positive. Excel's XIRR does the same job with irregular dates.
Because the rate compounds through time, cash that comes back sooner raises IRR even when the total dollars do not change. Cash that sits until exit lowers it. That is the distinction from MOIC. The multiple counts dollars. IRR counts dollars and when they arrived.
The formula also assumes that cash paid out along the way is reinvested at the same rate. In a fund it is not. An LP who receives a dividend in year two does not automatically earn the deal's IRR on that cash for the rest of the hold. A short, early exit can therefore make a portfolio look faster than the remaining companies will be.
Same multiple, different clock
Keep the equity cheque the same and vary only the years. $50 million of equity goes in. $100 million of equity comes out. MOIC is 2.0x in every row.
| Hold | MOIC | IRR (approx.) | Profit on $50m |
|---|---|---|---|
| 3 years | 2.0x | 26% | $50,000,000 |
| 5 years | 2.0x | 15% | $50,000,000 |
| 7 years | 2.0x | 10% | $50,000,000 |
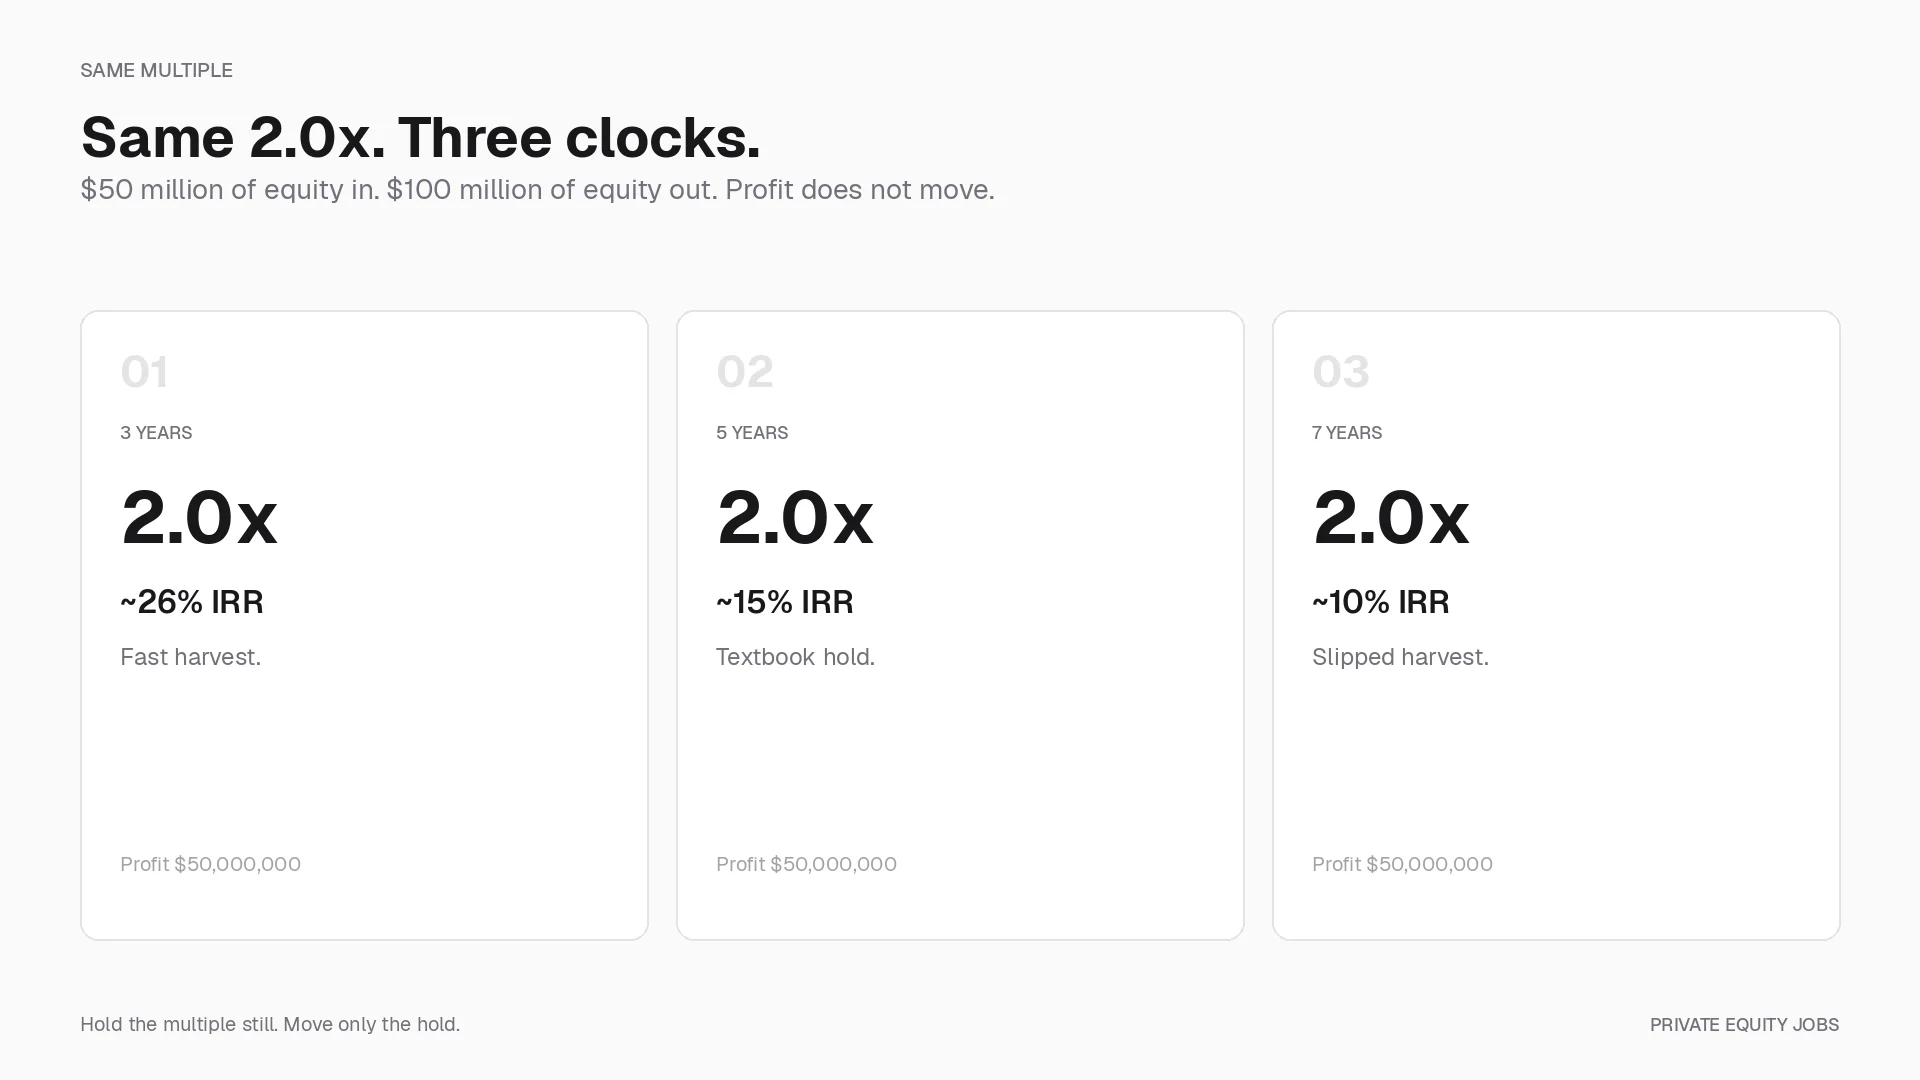
The profit is the same in each row. The rate is not. Bain & Company's Welcome to a New Era in Private Equity essay, part of the 17th Global Private Equity Report (23 February 2026), still treats 2.5x over five years as the usual target (about 20 percent IRR). Average holding periods at exit have drifted toward seven years. The same 2.5x over seven years is about 14 percent, which is why a slipped sale hurts even when the multiple still looks fine.
Interviews often use a short grid. The arithmetic is the same as the table above.
| MOIC | IRR in 3 years | IRR in 5 years |
|---|---|---|
| 2.0x | ~26% | ~15% |
| 2.5x | ~36% | ~20% |
| 3.0x | ~44% | ~25% |
A long IRR can also hide a late loss. An investment that compounds for many years and then loses half its value in the last year barely moves the annualized rate, even though the multiple is cut in two. Extra years in the average make a late shock look smaller than it was.
Which metric matters
Sponsors quote both because limited partners will ask for the other figure, and for how long the capital sat.
MOIC is the size of the gain in dollars. Two deals that both returned 3.0x over five years are the same story. A 3.0x that took eleven years is about 10 percent a year, which is not.
IRR is the speed. Capital is scarce, and the preferred return in the partnership is an IRR hurdle. If two paths return the same dollars and one of them returns cash earlier, that path has the higher IRR.
Ten percent in six months is a 1.1x and an IRR in the low twenties. Holding that rate for three and a half years is what it takes to reach 2.0x. A 40 percent IRR on a three-month stub barely moves a fund. A 3.0x that took eleven years did multiply the capital and still missed a mid-teens underwrite. Howard Marks, in You Can't Eat IRR (Oaktree, 12 July 2006), put it this way: a high internal rate of return does not put money in anyone's pocket until it is applied to a material amount of capital for a significant period of time.
The memo's Fund A and Fund B show the dollars. Both start with $1,000 and earn 10 percent, then 40 percent, then 100 percent. Fund A distributes early. Fund B holds.
| Fund A (distributes) | Fund B (holds) | |
|---|---|---|
| Starting capital | $1,000 | $1,000 |
| Year 1 / 2 / 3 returns | 10% / 40% / 100% | 10% / 40% / 100% |
| Time-weighted return | 45% | 45% |
| IRR | 21% | 45% |
| Cash back | $1,350 | $3,080 |
The yearly rates are the same. Fund A paid out $600 after year one and $650 after year two, so the 100 percent year ran on $50. Fund B kept the capital in, so that year ran on $1,540. The 45 percent time-weighted return on Fund A is not cash. The cash is $1,350 against $3,080.
In 2026 the hold is the hard part. Bain's illustration needs 10 to 12 percent annual EBITDA growth to underwrite that 2.5x in five years ("12 is the new 5"). Holds that slip toward seven years make the rate worse even if the multiple eventually prints.
DPI, TVPI, and paper marks
MOIC and IRR can both be mostly paper.
DPI (distributions to paid-in) is cash the fund has actually sent back, divided by capital paid in. It ignores remaining NAV. A 0.4x DPI means forty cents of cash per dollar called. The rest, if any, is still in companies.
RVPI (residual value to paid-in) is that remaining NAV divided by paid-in.
TVPI (total value to paid-in) is DPI plus RVPI. It is the fund-level cousin of MOIC.
An interim 1.8x TVPI with 0.3x DPI is a mark, not a distribution. Bain's 2026 essay is the current cash picture: buyout funds sit on $3.8 trillion of unrealized value, and distributions as a share of NAV are well below historical norms. Limited partners who have waited through a long stretch of unsold companies cannot spend TVPI.
The older the vintage, the more DPI should catch up with TVPI. If it does not, the multiple is a story about a long hold, not about cash returned. Secondaries and continuation vehicles exist because someone wants cash before a mark becomes a wire.
How IRR gets juiced
Two common tools move the clock without multiplying the dollars.
Subscription credit facility. The fund borrows against uncalled commitments, closes the deal, and calls LPs later. The investment has started. The LP has not yet written the cheque. IRR, which starts when cash leaves the LP, rises.
Take a $25 million equity cheque that is worth $75 million after five years. MOIC is 3.0x either way.
| Path | When the LP funds | MOIC | IRR (approx.) |
|---|---|---|---|
| Call on close | Day 1 | 3.0x | 25% |
| Facility delays the call one year | Day 365 | 3.0x | 32% |
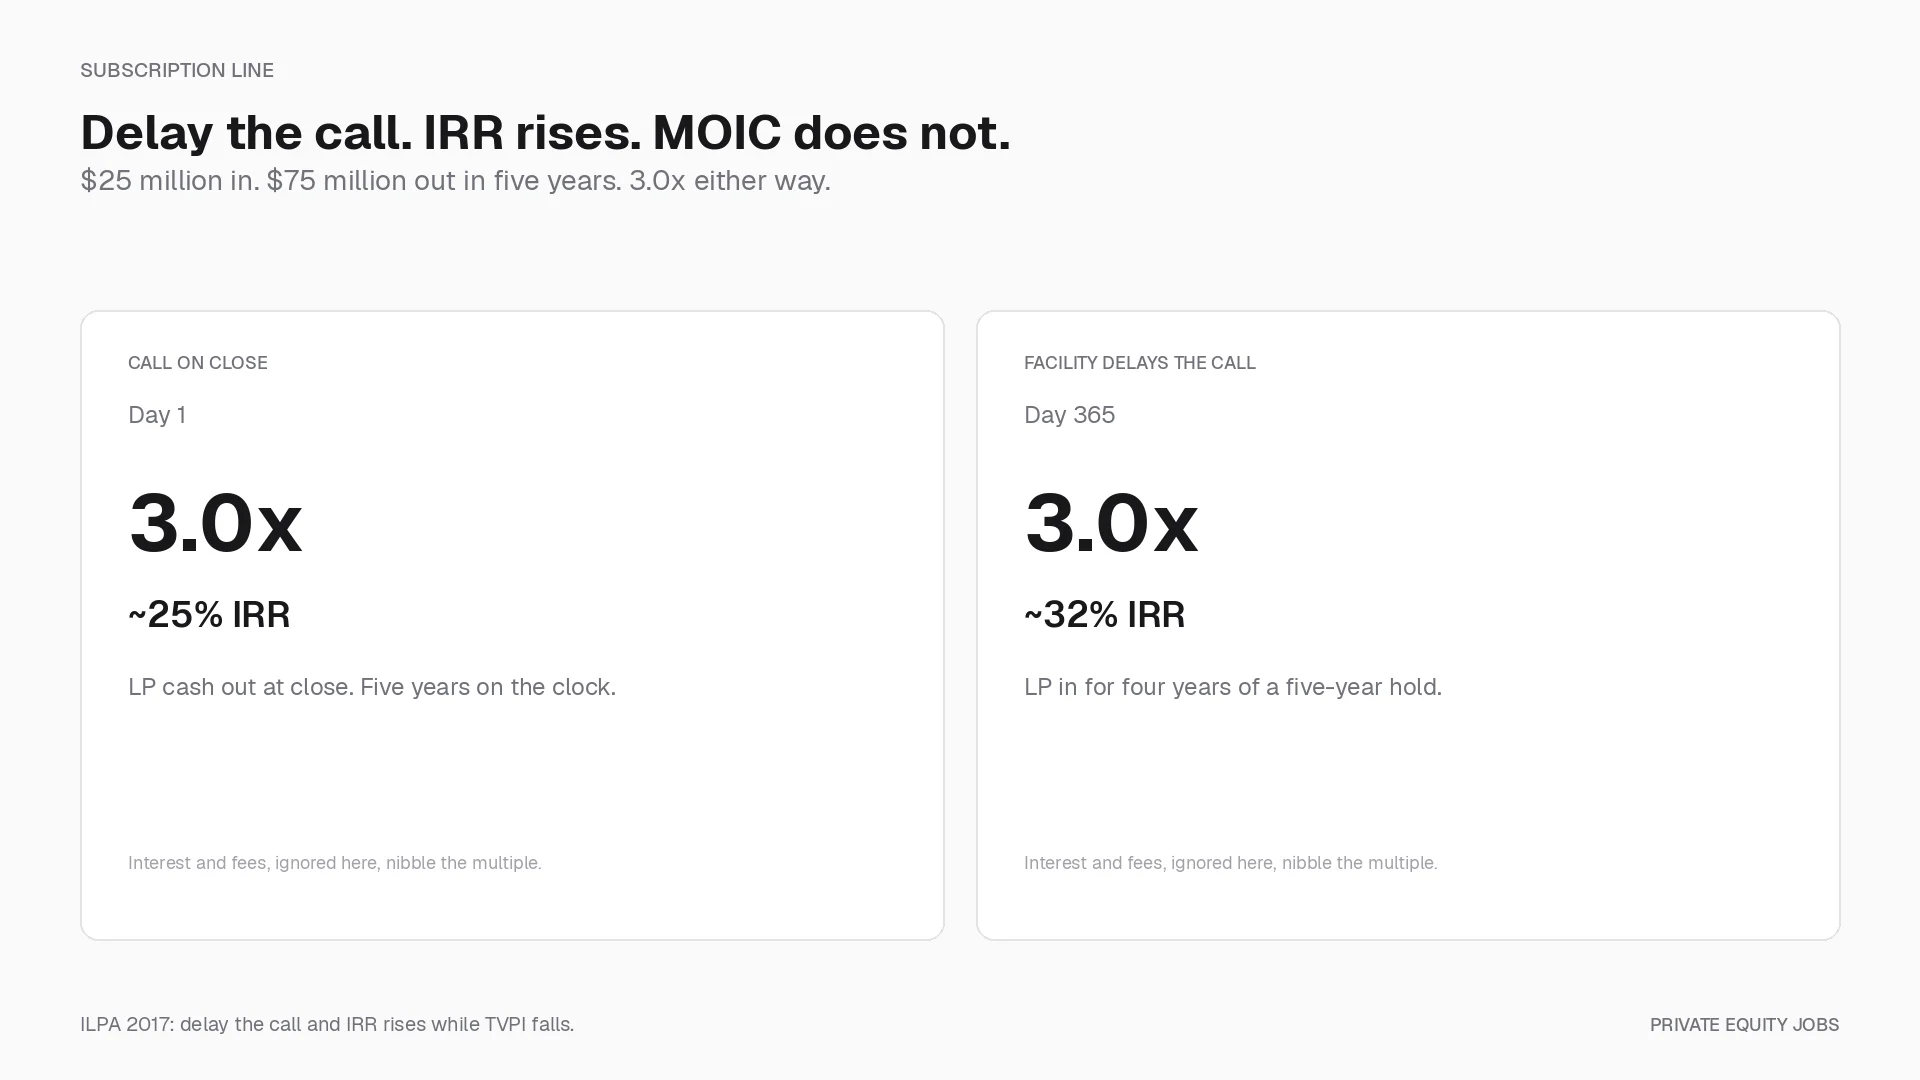
The multiple did not change. The LP was in the deal for four years of a five-year hold. Interest and unused fees, which this table ignores, trim the multiple a little. The Institutional Limited Partners Association's Subscription Lines of Credit and Alignment of Interests (June 2017) shows the same pattern with those costs included: delay the first call and IRR rises while TVPI falls. A one-year delay takes IRR from 6.62 percent to 7.14 percent and TVPI from 1.45x to 1.40x. A two-year delay takes IRR to 7.98 percent and TVPI to 1.35x. Across 498 funds, a Cobalt analysis cited in that paper found a median IRR increase of about two percentage points by year three, fading to less than half a point by the end of the fund.
ILPA's 2017 note treated a line of about 15 to 25 percent of uncalled capital, outstanding for no more than 180 days, as reasonable. A 2020 follow-on asked GPs to report net IRR with and without the facility. The ILPA Performance Template (January 2025) makes that pair the default for funds that start on or after 1 January 2026.
The line has an ordinary use. It lets a fund close a deal without asking every LP to wire on ten days' notice. Used for years as a way to start the investment clock before the LP clock, it is a way to raise the reported rate.
Dividend recapitalization. The portfolio company borrows and pays a dividend to the fund. Cash comes back early, so IRR rises. The company now has more debt and a thinner equity cushion. Marks's example: a fund buys a company for $200 expecting to make $40 in a year (20 percent IRR). A recap dividends out $180 at once. Invested capital is now $20, so the same $40 of expected profit is a 200 percent IRR. The expected gain is still $40. The recap changed the rate. It did not create the forty dollars.
A recap that is later followed by a larger exit can still be a good path. It is not free. The extra leverage sits on the company, which is the same place the LBO put the original stack.
Gross vs net
Gross MOIC and gross IRR are deal performance before the fund's fees and carry. Net is what LPs keep after management fees, expenses, and carried interest.
The gap is large enough to matter. Fees run from day one, so they hit IRR harder than they hit the final multiple. Carry comes out of profits, so it hits both. A 3.0x gross can be a 2.4x net without anyone having lied. The partnership waterfall is the order of payments: capital back, preferred return, catch-up, then 80/20.
When a pitch quotes one number, ask whether it is gross or net, and whether the IRR includes the subscription line.
Common questions
What does MOIC stand for?
Multiple on invested capital. Total value (cash plus remaining marks) divided by capital invested. It ignores time.
What does IRR stand for?
Internal rate of return. The annualized rate that sets the net present value of the cash flows to zero. It accounts for when the cash moved.
Which is more important, IRR or MOIC?
Limited partners look at both, and at how much has already been paid out. A high IRR on a small stub, or a large multiple on a long hold, needs the other figure before anyone can judge it.
What is a good MOIC or IRR?
Sponsors still talk about 2.0x to 3.0x MOIC and a mid-teens to 20 percent IRR on a five-year hold. Bain's 2026 illustration treats 2.5x in five years (about 20 percent IRR) as the target that now needs 10 to 12 percent annual EBITDA growth. That is an underwrite, not a market average.
How do subscription lines change the numbers?
They delay the LP's cash out, so IRR rises. MOIC is unchanged except for interest and fees, which trim it. ILPA's 2017 table shows the rate going up as the multiple goes down. New funds from 2026 are supposed to report both.
Is MOIC the same as TVPI?
When the fund is fully paid in, yes. Before that, TVPI divides by paid-in capital, which is smaller than the commitment, so TVPI can look larger than deal-level MOIC for reasons that have nothing to do with performance.
Sources
Bain & Company, Welcome to a New Era in Private Equity, 17th Global Private Equity Report, 23 February 2026. Institutional Limited Partners Association, Subscription Lines of Credit and Alignment of Interests, June 2017, and Enhancing Transparency Around Subscription Lines of Credit, June 2020. ILPA, Performance Template, January 2025. Howard Marks, You Can't Eat IRR, Oaktree Capital Management, 12 July 2006.