

Precedent transaction analysis values a company by looking at what buyers paid for similar companies in past acquisitions. An analyst collects a set of comparable deals, divides each purchase price by the target's earnings or revenue at the time of the deal, and applies the resulting range of multiples to the company being valued. Because each of those prices bought control of a whole company, the multiples include a control premium, the amount a buyer pays above the market value of a minority stake. Investment bankers use the method in pitch books, sale processes, and fairness opinions. Private equity firms use it to test the price of a company they are buying and the price they might get when they sell.
The 2025 sale of Walgreens Boots Alliance shows each step with filed numbers. When the pharmacy chain agreed on March 6, 2025 to be taken private by Sycamore Partners, both of the board's financial advisers, Centerview Partners and Morgan Stanley, ran a precedent transaction analysis. The merger proxy that Walgreens filed with the Securities and Exchange Commission (SEC) prints both. The two banks picked different deals, chose different multiple ranges, and disagreed on whether the analysis should count toward their opinions.
What precedent transaction analysis is
Precedent transaction analysis is a form of relative valuation, which reads value off prices other buyers have paid rather than off the company's own cash flows. Bankers also call it transaction comps, deal comps, mergers and acquisitions (M&A) comps, or acquisition comps, and merger filings usually title it "selected precedent transactions analysis" or "selected transactions analysis." It is one of the three standard methods in an investment bank's valuation work, with comparable company analysis (trading comps), which uses the market values of similar listed companies, and discounted cash flow (DCF) analysis, which discounts the company's projected cash flows.
The basic unit is a transaction multiple. For each past deal, the analyst takes the value the buyer paid for the whole business, its enterprise value (EV), meaning equity plus debt, less cash, and divides it by a measure of the target's results for the 12 months before the deal was announced. The most common measure is earnings before interest, taxes, depreciation, and amortization (EBITDA). Revenue multiples are used when targets have thin or negative earnings. Banks, insurers, and real estate companies are usually valued on price to book value, price to earnings, or funds from operations instead.
The prices in a precedent set are prices for control. A buyer of a whole company gets to set strategy, replace management, change the capital structure, and keep all the cash flows, so it usually pays more than the stock market price of a minority stake. That extra amount is the control premium. Transaction multiples also carry whatever the buyer expected from the deal, such as cost savings from combining two businesses (synergies), and the conditions at the time, such as the cost of debt and the number of competing bidders. For public targets, analysts often run a separate premiums paid analysis, which measures the offer price against the target's share price before news of the deal.
Why bankers and private equity firms use it
Buyers, sellers, and their advisers use precedents at different points in a deal:
- Sell-side bankers use precedents to set a client's price expectations before a sale and to show the client what a full price looks like. The valuation pages of a pitch book usually include a precedent range next to trading comps and a DCF.
- Buy-side advisers and acquirers use precedents to set a bid range and to check that an offer is not far above what comparable buyers paid.
- Boards and their advisers use precedents in fairness opinions, the letters in which a bank tells a board that the price in a deal is fair, from a financial point of view, to the shareholders. When a public company is sold for cash, the merger proxy summarizes the analyses behind each opinion, including the precedent table.
- Private equity firms use precedents to frame the entry multiple they pay and the exit multiple they assume when they model a leveraged buyout.
Precedents carry more weight for a private target, which has no share price and may have few listed peers. A precedent set also shows how active a sector is, from the number and size of recent deals, and the acquirers in the set are a first list of likely bidders.
How to screen for precedent transactions
Analysts screen on the target in each past deal, not on the acquirer, and they look for targets with a business, size, and risk profile close to the company being valued. The usual criteria are:
- Sector and business model. Same industry, similar products, customers, and end markets. A company that spans two industries, such as a retailer with a health care arm, may need deals from both.
- Size. Deal value or target revenue in a band around the company being valued.
- Date. A window long enough to find enough deals and short enough that market conditions are similar. Three to five years is common. Sectors with few deals need longer windows.
- Geography. Same country or region, since growth, regulation, and buyer pools vary by market.
- Deal type. Acquisitions of control, usually 100 percent of the company. Minority stakes do not carry a control premium. Most analysts use completed or signed deals and treat distressed sales and bankruptcy sales separately, because a forced seller takes a lower multiple.
- Buyer type. Strategic buyers, meaning operating companies, can pay for synergies. Financial buyers, meaning private equity firms and other sponsors, pay what the debt markets and their return targets allow. Analysts often tag each deal by buyer type so the split is visible.
- Consideration and process. Cash or stock, auction or negotiated sale, friendly or hostile. A contested auction or a hostile bid usually lifts the price.
Sets of roughly 5 to 15 deals are common. A long list pulls in targets that are not similar, and a short one lets one unusual deal set the median. The Walgreens advisers show two answers to the same problem, a large, low-growth retailer with few true peers:
- Centerview chose 11 deals involving "U.S. Grocery and North America General Retail companies," announced between November 2015 and December 2024. The filing gives no size cutoff and says the deals were chosen "based on its experience and professional judgment."
- Morgan Stanley chose 15 deals announced between February 2010 and December 2024 with an aggregate value of at least $0.8 billion. Three of them were deals by Walgreens itself: Rite Aid (13.0x), Alliance Boots (12.1x), and Duane Reade (about 11.4x).
Both banks went back about a decade or more because large grocery, drugstore, and general retail deals are rare. A narrow, recent window gives deals that look alike but too few of them, while a wide one gives enough deals but mixes different interest rates and markets.
Where precedent transaction data comes from
Each multiple needs two inputs from the time of the deal: the price paid and the target's financial results. For deals involving U.S. public companies, both are in SEC filings on EDGAR, the SEC's public filing database. The filings that matter are:
- Merger proxy statement. When shareholders vote on a cash merger, the target files a preliminary proxy (Form PREM14A) and then a definitive one (Form DEFM14A). The section titled "Opinion of" each financial adviser summarizes the bank's analyses, often including a table of selected transactions with each multiple. In a stock deal, the same material appears in the buyer's registration statement on Form S-4.
- Tender offer documents. When a buyer offers to purchase shares directly, the target's Schedule 14D-9 carries the same summary of the bank's analyses.
- Going-private filings. In a take-private involving insiders or affiliates, Rule 13e-3 requires a Schedule 13E-3, whose exhibits include bank presentations "materially related" to the deal. Walgreens filed Centerview's February 4, 2025 discussion materials as exhibit (c)(7) to its Schedule 13E-3.
- Form 8-K. The announcement press release and the merger agreement, usually filed within days of signing, give the price per share, the form of payment, and any contingent payments.
- The target's last 10-K and 10-Q before announcement. These give the balance sheet (debt, cash, share count) and the quarterly results needed to build the last twelve months (LTM).
Fairness opinion summaries are the closest thing to a free precedent database, since each lists the deals a bank judged comparable, with the multiples it calculated. Run EDGAR full-text search on a recent deal in the sector, open the DEFM14A, SC 14D9, or SC 13E3 filing, and search the document for "precedent" or "selected transactions." In the Walgreens DEFM14A, Centerview's table is on page 79 and Morgan Stanley's on page 88.
Subscription databases such as Capital IQ, FactSet, PitchBook, LSEG (which includes the former SDC Platinum data), Bloomberg, and Mergermarket let an analyst screen deals by sector, size, date, and geography. Their figures still need checking against filings, because each vendor defines enterprise value and EBITDA its own way, and deals for private targets often have no disclosed financials. Equity research reports published around a deal are another source, and banks keep precedent sets from earlier pitch books in the same sector, which is often where an analyst starts.
How to calculate transaction multiples
A transaction multiple divides the enterprise value implied by the deal price by the target's results before the deal. The work is in making both numbers consistent across every deal in the set. The steps are:
- Equity purchase price. Multiply the offer price per share by the target's fully diluted share count. Dilution uses the treasury stock method, which counts in-the-money options, warrants, and restricted and performance stock units at the offer price and assumes option proceeds buy back shares. Convertible securities count if the offer price makes them worth converting.
- Transaction enterprise value. Add the target's debt and other claims that rank ahead of common equity, such as preferred stock and minority (noncontrolling) interests. Subtract cash and investments that are not part of the operating business.
- The denominator. Use the target's revenue or EBITDA for the last twelve months reported before announcement, built from the latest 10-K and 10-Qs. Remove one-time items such as restructuring charges and litigation costs, and use the same definition of EBITDA for every deal, without mixing reported figures with figures that add a buyer's expected synergies.
- Divide. Enterprise value over LTM EBITDA gives EV/LTM EBITDA, the most quoted transaction multiple.
In a hypothetical deal, a buyer pays $20 per share for a target with 100 million diluted shares, an equity purchase price of $2.0 billion. Adding $500 million of debt and subtracting $100 million of cash gives an enterprise value of $2.4 billion, and on LTM EBITDA of $300 million the multiple is 8.0x.
Centerview's definition in the Walgreens proxy shows the convention in a bank's own words. For each deal it calculated "the offer value (determined using the treasury stock method and taking into account outstanding in-the-money options, warrants, restricted stock units, performance stock units and other convertible securities), plus the book value of debt and certain liabilities less cash and cash equivalents and certain non-majority owned equity investments," as a multiple of LTM EBITDA "as of the time of the transaction announcement." Morgan Stanley used the same idea under a different name, aggregate value (AV), and printed the AV of each deal next to its multiple. Dividing one by the other recovers the EBITDA the bank used. Walgreens' 2015 agreement to buy Rite Aid, listed at $17.2 billion and 13.0x, implies LTM EBITDA of about $1.3 billion (PEJ's arithmetic from the filed figures).
Most analysts use LTM figures for precedents. Projections for a target at the time of its sale are rarely public, and those that are may include the buyer's expected synergies. Sets in fast-growing or cyclical sectors sometimes add a forward multiple based on equity research estimates published before the announcement, but LTM and forward multiples should not be mixed in one column.
A few cases need adjustments:
- Stock deals. Value the buyer's shares at their price on the announcement date, and note the exchange ratio.
- Contingent payments. Earnouts and contingent value rights add value that may never be paid. Walgreens shareholders received $11.45 in cash plus one divested asset proceed (DAP) right, worth up to $3.00 in cash depending on the sale of the company's interests in Village Practice Management Company. Centerview valued the right at $0.90 to $1.40 and Morgan Stanley at $1.19 to $1.91, which is why the two banks state different "Implied Consideration Value" ranges for one deal: $12.35 to $12.85 and $12.64 to $13.36.
- Partial acquisitions. If a buyer acquired a majority stake rather than 100 percent, gross the price up to an implied value for the whole company, or leave the deal out.
- Fiscal years and currencies. Align LTM periods to the announcement date and convert foreign deals at the exchange rate on that date.
The control premium and premiums paid analysis
A premium is the offer price per share divided by the target's unaffected share price, minus one. The unaffected price is the price before news of the deal reached the market, usually the close on the last trading day before the announcement or before the first leak or rumor. Analysts also measure premiums against the price one week or one month earlier and against a volume-weighted average price (VWAP) over 30 or 90 days, because a stock can drift up for weeks before a deal becomes public.
Walgreens shows why the date matters. The proxy measures the offer against $8.85, the close on December 9, 2024, "the last trading day before media reports of a possible going private transaction." On that base the $11.45 cash payment is a premium of about 29 percent, and the full consideration including the DAP right is a premium of up to 63 percent. Against the 30- and 90-day VWAPs to the same date, the cash premium was about 28 and 22 percent.
A premiums paid analysis applies the premiums from a set of past deals to the target's unaffected price. The two Walgreens advisers built different sets and used different unaffected dates:
| Centerview | Morgan Stanley | |
|---|---|---|
| Deal set | Take-private transactions of public companies since 2019, transaction value above $5 billion | U.S. public cash deals since 2000, aggregate equity value above $1 billion |
| Statistic printed | Not stated | Median one-day premium 43% |
| Range applied | 20% to 45% | 22% to 51% (25th to 75th percentile) |
| Unaffected price | $8.85 (December 9, 2024) | $9.70 (February 14, 2025, the last trading day before rumors of a revived merger) |
| Implied value per share | $10.60 to $12.80 | $11.85 to $14.65 |
Source: Walgreens Boots Alliance, DEFM14A filed June 6, 2025, pages 81 and 89.
Morgan Stanley's later date follows public rumors in February 2025 of a "revived potential Merger," two months after the December reports. The $0.85 difference in the base price shifts the whole range. Both banks treated the premiums analysis as secondary. Centerview listed it under "Other Factors," which it noted "solely for reference and informational purposes," and Morgan Stanley said it "was presented for reference purposes only and was not relied upon for valuation purposes."
A premiums analysis has a built-in limit. It always gives a value above the unaffected price, so it can support an offer but cannot show that a company is overvalued. It also applies only to public targets, since a private company has no share price to measure against.
How to apply the range to the company
With the multiples calculated, the analyst sets out the summary statistics (low, 25th percentile, median, mean, 75th percentile, high) and then picks a range. Bankers move the range up or down for differences in growth, margins, size, and market conditions between the company and the targets in the set, and for deal-specific factors in the set itself, such as a bidding war that lifted one price or a distressed seller that lowered another. Morgan Stanley's Walgreens opinion makes the point in its premiums analysis: "Mathematical analyses (such as determining the mean or median) are not in themselves a meaningful method of using comparable data."
Deal conditions explain much of the spread, so analysts often tag each deal with the factors that moved its price:
- Factors that raise a multiple. A contested auction with several bidders, a strategic buyer with large expected synergies, a deal struck when market multiples and credit availability were at a peak, and a target with assets that buyers cannot find elsewhere.
- Factors that lower a multiple. A seller under financial pressure, a process with one serious bidder, a business that will be hard to integrate, and a long or uncertain antitrust review.
Where the company lands in the range depends on which group of deals it resembles.
The range is then applied in three steps:
- Implied enterprise value. Multiply the low and high multiples by the company's LTM EBITDA (or revenue).
- Implied equity value. Subtract debt and other claims and add cash and non-operating assets, using the same definitions as in the precedent set.
- Value per share. Divide by fully diluted shares, recalculated with the treasury stock method at each implied price.
For Walgreens, Centerview selected a range of 5.5x to 7.5x LTM EBITDA "derived from the selected precedent transactions" and applied it to the company's LTM Adjusted EBITDA as of November 30, 2024. Its bridge from enterprise value to equity value subtracted net debt, capital leases, the present value of certain "dark rent" payments, potential opioid liabilities, and legal settlements after November 30, 2024, and added equity method investments and stake sales after that date. The result was $6.90 to $15.20 per share. Morgan Stanley applied 5.0x to 8.0x to LTM Adjusted EBITDA of $3,662 million and got $4.60 to $16.95.
On Centerview's figures, each one-turn change in the multiple moves the value by about $4.15 per share; on Morgan Stanley's, one turn of $3,662 million is about $3.7 billion of enterprise value, or about $4.12 per share (both PEJ's arithmetic from the filed ranges). Walgreens' unaffected share price was $8.85, so half a turn of judgment in the range was worth about a quarter of the pre-rumor stock price. Companies with high debt relative to equity value behave this way, because a change in enterprise value falls entirely on the equity.
The same arithmetic can be run backward to find the multiple an offer implies. On Centerview's bridge, its Implied Consideration Value of $12.35 to $12.85 works out to about 6.8x to 6.9x LTM Adjusted EBITDA, and the $11.45 cash payment alone to about 6.6x (PEJ's interpolation within Centerview's range; the proxy does not print these multiples). Those figures sit next to the 6.9x median of Centerview's 11 deals.
Worked example with two banks' tables from the Walgreens take-private
Sycamore Partners, a private equity firm, signed its agreement to acquire Walgreens Boots Alliance on March 6, 2025 and completed the merger on August 28, 2025. Centerview and Morgan Stanley each delivered a fairness opinion to the Walgreens board dated March 6, 2025, summarized in the definitive merger proxy filed on June 6, 2025, and each built its own precedent table.
Centerview's selected transactions
Centerview grouped its deals into U.S. grocery and North American general retail and reported each deal's total enterprise value as a multiple of LTM EBITDA, which the filing labels TEV/LTM EBITDA. The buyer type column is PEJ's classification.
| Announced | Target | Acquirer | Buyer type | TEV/LTM EBITDA |
|---|---|---|---|---|
| May 11, 2022 | The Fresh Market | Cencosud | Corporate | 8.0x |
| May 14, 2021 | Smart & Final Stores | Bodega Latina | Corporate | 3.7x |
| April 16, 2019 | Smart & Final Stores | Apollo Global Management | Sponsor | 6.5x |
| July 26, 2018 | Supervalu | United Natural Foods | Corporate | 7.0x |
| June 16, 2017 | Whole Foods Market | Amazon.com | Corporate | 10.6x |
| October 17, 2016 | Save-A-Lot | Onex | Sponsor | 7.0x |
| March 14, 2016 | The Fresh Market | Apollo Global Management | Sponsor | 7.1x |
| November 11, 2015 | Roundy's | Kroger | Corporate | 6.9x |
| December 23, 2024 | Nordstrom | Nordstrom family, El Puerto de Liverpool | Family and corporate | 5.7x |
| June 28, 2017 | Staples | Sycamore Partners | Sponsor | 5.0x |
| August 15, 2015 | Belk | Sycamore Partners | Sponsor | 6.9x |
Medians printed by Centerview: U.S. grocery 7.0x, North America general retail 5.7x, total 6.9x. Source: Walgreens Boots Alliance, DEFM14A filed June 6, 2025, page 79.
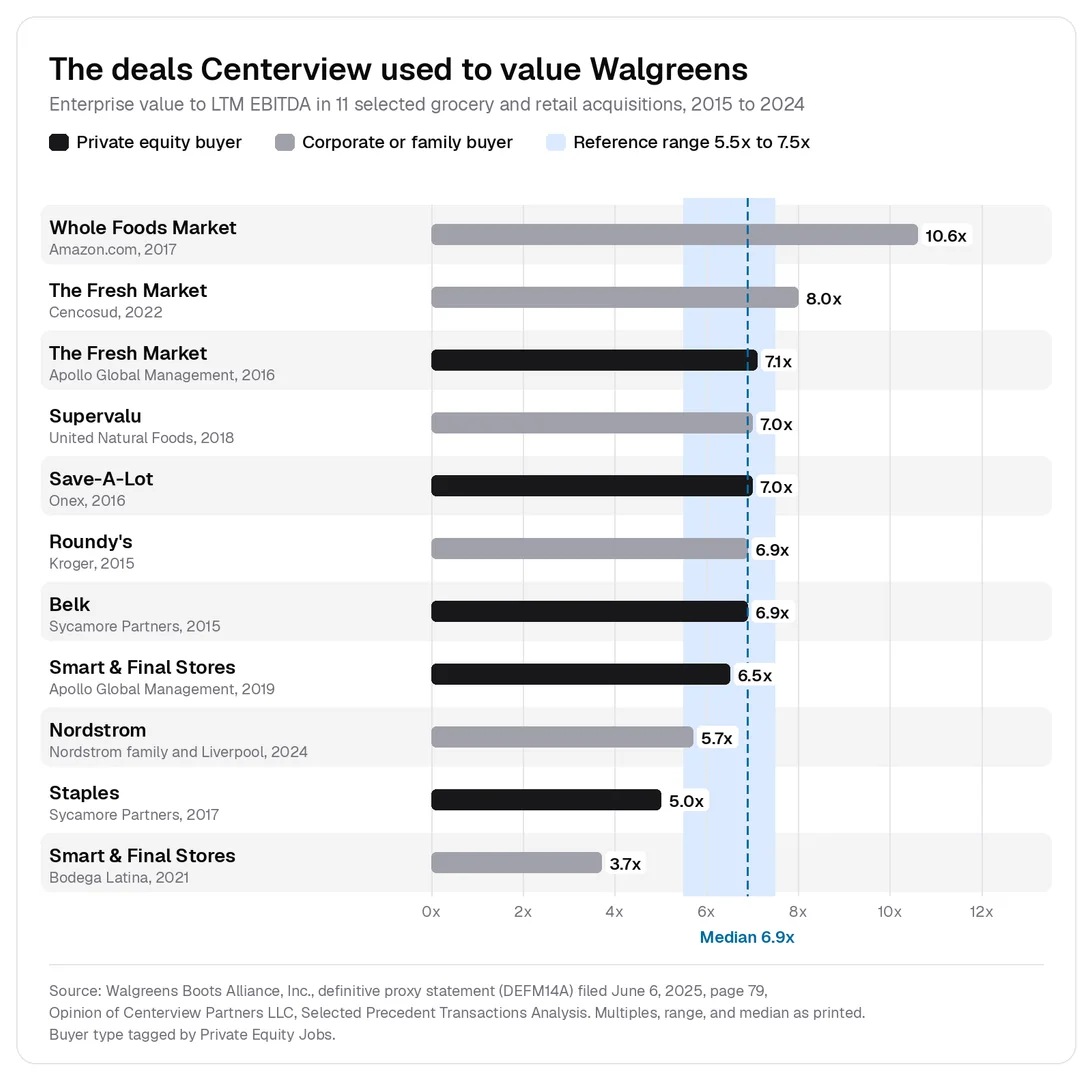
Centerview wrote that "none of the selected transactions is directly comparable" and chose a reference range of 5.5x to 7.5x. The range covers the seven deals between 5.7x and 7.1x and leaves out four: Amazon's purchase of Whole Foods at 10.6x, Cencosud's purchase of The Fresh Market at 8.0x, Sycamore's purchase of Staples at 5.0x, and the 2021 sale of Smart & Final at 3.7x. Centerview treated the analysis as one of its three main methods, with trading comps and a DCF.
Morgan Stanley's precedent transactions
Morgan Stanley's list overlaps with Centerview's on eight deals, each at the same multiple: both Fresh Market sales, Smart & Final in 2019, Save-A-Lot, Roundy's, Nordstrom, Staples, and Belk. Its other seven deals are below.
| Announced | Target | Acquirer | AV ($ billion) | AV/LTM EBITDA |
|---|---|---|---|---|
| 10/2015 | Rite Aid | Walgreens | 17.2 | 13.0x |
| 6/2012 | Alliance Boots | Walgreens | 30.8 | 12.1x |
| 2/2010 | Duane Reade | Walgreens | 1.1 | ~11.4x |
| 11/2015 | Petco | CVC, CPP Investments | 4.6 | ~9.0x |
| 7/2013 | Harris Teeter | Kroger | 2.5 | 7.4x |
| 3/2014 | Safeway | Albertsons | 9.0 | 5.5x |
| 10/2022 | Albertsons | Kroger | 24.6 | 5.4x |
Morgan Stanley deals not in Centerview's set. The full table lists 15 deals; the filing names the acquirer in the first three rows as "Company," meaning Walgreens. Source: DEFM14A, page 88.
Morgan Stanley picked a range of 5.0x to 8.0x, which leaves out the four deals at about 9x or higher, including Walgreens' own three deals, and then set the result aside. The proxy says the analysis "was for reference only because the selected transactions were not, in Morgan Stanley's professional judgment and experience, similar enough to make a meaningful comparison," and that it "was presented for reference purposes only and was not relied upon for valuation purposes."
What the two tables show
- The medians barely moved. Centerview's 11 deals have a median of 6.9x. Morgan Stanley's 15 have a median of 7.0x, and 6.9x once Walgreens' own three deals are removed (PEJ's calculation from the filed table). Changing the deal list changed the range more than the center.
- Judgment set the range. Each bank chose a range that left some deals outside it, and they left out different ones. Morgan Stanley's range is one turn wider, which added about $4 per share to the spread of values.
- Sponsors paid in the middle of the set. The five sponsor deals in Centerview's table (Apollo twice, Onex, Sycamore twice) run from 5.0x to 7.1x, with a median of 6.9x. The five corporate deals run from 3.7x to 10.6x, with a median of 7.0x (PEJ's split). In this set, strategic buyers produced both the highest and lowest multiples, and the private equity buyers did not pay less at the median.
- The buyer was already in the set. Sycamore bought Belk at 6.9x and Staples at 5.0x. When a sponsor is the bidder, its earlier deals in the sector may already be in the set, which lets a board compare the offer with what the same buyer paid before.
- One company can appear twice. Smart & Final shows up at 6.5x when Apollo bought it in 2019 and at 3.7x when Bodega Latina bought it two years later. The same business changed hands two years apart at multiples 2.8 turns apart.
- The offer sat in the upper half of both ranges. On each bank's figures, the consideration implied a multiple near the median of its set, about 6.8x to 6.9x against Centerview's 6.9x and about 7.0x to 7.1x against Morgan Stanley's 7.0x (PEJ's arithmetic).
Precedent transactions vs comparable company analysis and DCF
Bankers run the three methods together, and each answers a different question.
| Precedent transactions | Comparable company analysis | Discounted cash flow | |
|---|---|---|---|
| Question it answers | What have buyers paid for control of similar companies? | What does the market pay today for a minority stake in similar companies? | What are the company's own projected cash flows worth today? |
| Source of value | Past deal prices | Current share prices of listed peers | Management or analyst projections and a discount rate |
| Control premium | Included | Not included | Not included unless the projections include a buyer's plans |
| Time basis | Prices at past announcement dates, usually LTM results | Today's prices, often on forward estimates | Forecast period plus a terminal value |
| Main weakness | Few truly similar deals; data can be old or incomplete | Market mood moves the result; peers may not match | Result depends on forecasts, discount rate, and terminal value |
| Typical use | Sale pricing, fairness opinions, private targets | Pricing listed companies, IPOs, cross-checks | Intrinsic value, fairness opinions, buyer's own view |
The usual rule is that precedents produce higher values than trading comps because of the control premium. The rule holds when market conditions are similar, but a deal list spread over many years can produce a lower range if the old deals were struck in cheaper markets. In Centerview's Walgreens work, the three main methods gave these per-share ranges:
| Centerview analysis | Multiple or main input | Implied value per share |
|---|---|---|
| Selected public companies (trading comps) | 5.0x to 7.0x next twelve months (NTM) Adjusted EBITDA; peer average 5.9x | $4.60 to $12.70 |
| Selected precedent transactions | 5.5x to 7.5x LTM Adjusted EBITDA; median 6.9x | $6.90 to $15.20 |
| Discounted cash flow | Discount rates of 9.25% to 10.75%; terminal multiples of 5.0x to 7.0x | $10.80 to $19.10 |
Source: DEFM14A, pages 77 to 81. Implied Consideration Value $12.35 to $12.85.
The precedent range sits above the trading range, as the rule predicts, though the two use different bases (LTM against NTM EBITDA). The large grocery and retail deals in Centerview's set were priced at modest multiples, not far above where the listed peers traded.
A private equity buyer adds a fourth view, a leveraged buyout analysis, which works out the highest price a sponsor can pay and still earn its target return with the debt available.
Where precedent transactions sit on a football field
Bankers summarize a valuation on a football field, a chart with one horizontal bar per method showing the low and high value per share, with the offer price or current share price drawn as a vertical line across all of them. The proxy prints Centerview's ranges as text rather than as a chart:
| Centerview analysis | Implied value per share | Status in the opinion |
|---|---|---|
| Selected public companies | $4.60 to $12.70 | Main analysis |
| Selected precedent transactions | $6.90 to $15.20 | Main analysis |
| Discounted cash flow | $10.80 to $19.10 | Main analysis |
| Analyst price targets (14 reports) | $7.00 to $15.00 | For reference |
| Premiums paid | $10.60 to $12.80 | For reference |
| Discounted future share price | $8.10 to $10.40 | For reference |
| Sum of the parts | $8.20 to $13.90 | For reference |
| Implied Consideration Value | $12.35 to $12.85 | The offer being tested |
Source: DEFM14A, pages 77 to 81.
The precedent bar spans $8.30, close to the full unaffected share price of $8.85, and ties with the DCF bar as the widest of Centerview's three main analyses. A board reading a football field asks where the offer falls within each bar. Here the offer sits above the whole discounted future share price bar, at the top of the trading comps and premiums bars, and inside the precedent, DCF, analyst target, and sum of the parts bars. The premiums bar is narrow because Centerview applied its 20% to 45% range to one share price. The precedent bar is wide because each turn of EBITDA moved Walgreens' equity by about $4.15 per share, so a two-turn range spans more than $8. Other common bars are the 52-week trading range, which Morgan Stanley showed for Walgreens at $8.08 to $22.05 for the year to March 3, 2025 "for reference purposes only," and an LBO analysis when a sponsor is a likely buyer.
Pros and cons of precedent transaction analysis
Advantages
- It uses real prices. Each multiple is what a buyer paid after diligence and negotiation, not a model output.
- It includes control. Because the prices are for whole companies, the result reflects what a buyer pays for control, which is the question in a sale.
- It is easy to explain. A board or an investment committee can follow "similar companies sold for 5.5x to 7.5x EBITDA" without a model.
- It works for private companies. A private target has no share price, but its sector usually has deal history.
- Boards expect it. Fairness opinions in public company sales usually include it, as both Walgreens opinions did.
Disadvantages
- Deals are rarely comparable. Each price reflects its own synergies, competition, financing, and seller situation. Morgan Stanley set its Walgreens analysis aside for this reason.
- Data is old or missing. Good sets often reach back a decade, and private deals often lack disclosed EBITDA.
- Market conditions change. A multiple paid when debt was cheap may not be available when rates are higher.
- Structures differ. A buyer of assets can get tax deductions that a buyer of shares does not, so similar headline multiples can reflect different economics.
- Ranges are wide. One turn of EBITDA moved Walgreens' value by about $4 per share, almost half the unaffected share price.
- It looks backward. The method says what buyers paid, not what the target's cash flows will support. A DCF or LBO analysis answers that.
- It records only deals that closed or signed. A price a buyer later regretted counts the same as a sound one, and deals that failed over price leave no multiple at all.
Precedent transaction questions in interviews
Precedent transactions come up in banking and private equity interview questions as a check on whether a candidate understands what drives a price.
Walk me through a precedent transaction analysis. Pick deals with similar targets in a relevant period, find the purchase price and the target's financials at announcement for each, calculate enterprise value to EBITDA and other multiples, choose a range using the median and the closest deals, and apply it to the company's EBITDA to get an enterprise value, then bridge to equity value per share.
Why are precedent multiples usually higher than trading multiples? Because the buyer paid a control premium to take over the whole company, often based on expected synergies. Trading multiples price small minority stakes.
When would precedents come out lower than trading comps? When the deals were struck in weaker markets than today's, when the set includes distressed sales, or when peers trade at high forward multiples. Walgreens was not such a case. Centerview's precedent range of $6.90 to $15.20 per share sat above its trading range of $4.60 to $12.70.
Which deals would you leave out? Deals where the price reflects something unusual: a bidding war, a distressed seller, a strategic buyer paying for large synergies, or a target with a very different growth rate. Centerview left Amazon's 10.6x purchase of Whole Foods and the 3.7x second sale of Smart & Final outside its range.
How private equity firms use precedent transactions
On the buy side, a private equity firm uses precedents to judge whether an asking price is realistic before it spends money on diligence. A private equity associate screening a deal pulls recent sales in the sector, sponsor deals in particular, to see what multiple the seller's banker is likely to ask for.
The analysis then feeds several parts of the deal work:
- Entry price. The precedent range is one check on the purchase multiple that goes into the LBO model and the sources and uses table. If the price needed to win is above the range, the deal team has to explain why.
- Exit assumptions. Precedent sales to strategic buyers and other sponsors show what exit multiples have been achieved in the sector, a check on the exit multiple in the model.
- Add-on strategy. A platform company that buys smaller businesses at lower multiples than its own expected exit multiple benefits from multiple arbitrage. Precedents for small and large deals in the same sector show how big that gap is.
- The investment committee. The investment committee memo usually includes a valuation section comparing the proposed price with trading comps and precedents, so the committee can see where the bid sits.
Common questions
What is a precedent transaction?
A precedent transaction is a completed or announced acquisition of a company similar to the one being valued. Its price, expressed as a multiple of the target's EBITDA, revenue, or earnings, is a reference point for what a buyer might pay for the company today.
What does precedent transaction analysis tell you?
It tells you the range of multiples buyers have paid to acquire control of similar companies, and so the range of values a seller can reasonably expect in a sale. It does not tell you what the company's own cash flows will support.
What is the difference between precedent transactions and comparable company analysis?
Comparable company analysis uses the current trading multiples of similar listed companies, which reflect minority stakes. Precedent transaction analysis uses multiples paid in past acquisitions, which include a control premium, so it usually gives higher values from older and less complete data.
Where can you find precedent transaction data?
For U.S. public targets, the fairness opinion summaries in merger proxies, Schedule 14D-9 filings, and going-private filings on Schedule 13E-3 list selected transactions and their multiples. Capital IQ, FactSet, PitchBook, and similar databases collect the same data for faster screening.
How many transactions should a precedent analysis include?
Enough to show a pattern, usually 5 to 15. Centerview used 11 deals for Walgreens and Morgan Stanley used 15. A short set of close matches is more useful than a long set of loose ones.
What are the four types of transactions?
In M&A, deals are commonly grouped into four types by the relationship between the companies: horizontal (two competitors in the same business), vertical (a company and a supplier or customer), concentric or congeneric (related businesses that share customers or technology), and conglomerate (unrelated businesses). Screening for precedents usually starts with horizontal deals, because those targets are the closest match.
Sources
- Walgreens Boots Alliance, Inc., Definitive proxy statement on Schedule 14A (Form DEFM14A), filed June 6, 2025, sections "Opinion of Centerview Partners LLC" (pages 74 to 82) and "Opinion of Morgan Stanley" (pages 83 to 91).
- Walgreens Boots Alliance, Inc., Current report on Form 8-K, filed August 28, 2025, reporting completion of the merger.
- Electronic Code of Federal Regulations, 17 CFR 229.1015, Item 1015 of Regulation M-A, Reports, opinions, appraisals and negotiations.
Related posts
Related posts

A pitch book is the presentation an investment bank uses to win a mandate. Types, the pages in order, the valuation pages, who builds each part, and real bank decks filed with the SEC.

Corporate finance runs a company's own money; investment banks advise companies on deals for a fee. The jobs inside each, 2026 posted pay, recruiting, hours, and how people move between them.

Investment banks are paid per deal; asset managers are paid a percentage of the money they run. How the jobs, recruiting, pay, hours, and career paths compare, with 2026 postings, MBA reports, and 10-K filings.