

Sum-of-the-parts valuation values each of a company's business segments on its own, then adds those values to get a total for the firm. Analysts often call the method sum of the parts (SOTP), or a break-up valuation. After the segment values are summed, the model subtracts net debt and other claims that sit above equity, and adds non-operating assets, so the result is an equity value and an implied share price. The method is used when one blended multiple or one company-wide discount rate would misprice divisions that grow, earn, and compete differently.
In the definitive merger proxy for Walgreens Boots Alliance's take-private by Sycamore Partners, Centerview Partners ran an illustrative sum-of-the-parts analysis that put the company's common stock at about $8.20 to $13.90 per share. Morgan Stanley printed a sum-of-the-parts comparable companies analysis, for reference only, at $10.85 to $16.90 per share on an aggregate value to 2025 estimated adjusted earnings before interest, tax, depreciation and amortization (EBITDA) basis. The deal's cash consideration was $11.45 per share. Those filed ranges are the worked example on this page.
What sum-of-the-parts valuation is
A single trading multiple treats the company as one business. Sum-of-the-parts valuation does the opposite. It splits the firm into the segments that management reports, or into units that a buyer could sell or spin, values each unit with the method that fits that unit, and adds the results. The sum is an enterprise value for the operating businesses. Equity value is that enterprise value minus net debt and other non-operating liabilities, plus cash and other non-operating assets, then divided by diluted shares.
In formula form, equity value is the sum of the segment enterprise values, minus net debt and other non-operating liabilities, plus non-operating assets. Share price is equity value divided by diluted shares. The hard work is not the last division. It is choosing segments, peers, and the bridge items so the sum means something.
The reason the split matters is that peers and discount rates are not the same across unrelated businesses. A retail pharmacy chain, an international drugstore brand, and a specialty pharmacy platform do not trade at the same enterprise value to EBITDA multiple. A discounted cash flow (DCF) model that used one weighted average cost of capital for all three would bury those differences. Sum-of-the-parts valuation makes the differences explicit. The same logic applies when one division is a high-growth software business and another is a mature industrial cash generator: one multiple on consolidated EBITDA usually understates the growth piece, overstates the mature piece, or both.
Banks print the method on fairness-opinion pages next to trading comps, precedent transactions, and DCF. Equity research uses it when a conglomerate's parts are clearer than the consolidated story. Activists and boards use it when they ask whether the market is paying less for the whole than it would pay for the pieces. In each setting the output is a range, not a single point, because every segment carries its own multiple or discount-rate band.
When to use sum-of-the-parts valuation
Sum-of-the-parts valuation fits when the firm has more than one economically distinct business and the market, or a deal process, needs to see those businesses separately.
- Conglomerates and multi-segment listed companies. Different industries, margins, growth rates, or capital intensity sit under one share price. A blended multiple averages them. Coverage analysts often keep a segment sheet even when the official rating is based on a company-level DCF.
- Spin-offs, split-offs, tracking stocks, and equity carve-outs. The question is whether a subsidiary is worth more outside the parent. The model values the piece that would leave and the stub that would stay, then asks what corporate costs remain with each.
- Break-up and defense work. A board facing a hostile bid, or testing strategic alternatives, wants to know what the pieces would fetch if sold or separated. Macabacus lists classic candidates such as media groups with parks, networks, and studios under one holding company for the same reason.
- Restructuring. Distressed companies sell non-core units for liquidity. Sum-of-the-parts valuation sizes those units against what a buyer might pay in a hurry, which is often a discount to a healthy-process multiple.
- Fairness opinions on multi-segment targets. Sell-side advisers often show a segment build alongside company-level methods so the board can see which divisions support the offer price. That is the Walgreens case below.
Private multi-segment firms use the same build when a sale, spin, or financing needs a price for one unit rather than for the whole group.
It is the wrong first tool for a single-product company with one peer set, or for a firm whose segments share so much cost and revenue that they cannot be valued as if they stood alone. In those cases trading comps, precedents, or a company-level DCF is enough. It is also a weak primary method when there is no realistic path to sell or separate the units and the strategic value of keeping them together dominates the math.
How to identify segments and pick a method
The build has four working steps before the equity bridge.
- Define the segments. Start from the segments in the annual report and investor presentations. Split further only when a unit has its own peers, contracts, or sale process. Keep a corporate or "other" line for costs and assets that do not belong inside an operating segment.
- Normalize segment financials. Use revenue, EBITDA, EBIT, or another metric that matches how peers are valued. Strip one-time items. Align lease accounting with the peer set when IFRS 16 or capital leases would otherwise distort the multiple. Undo transfer-pricing or intercompany charges that would not survive a separation. Allocate shared costs with a rule you can defend, or leave corporate costs as their own line. Segment EBITDA should reconcile to consolidated EBITDA.
- Choose a method per segment. Trading comps fit when public peers exist for that segment; the multiple may be on revenue, EBITDA, EBIT, or net income, matching how that peer set trades. Precedent transactions fit when the question is what a buyer would pay for control of that segment. DCF fits when forecasts are credible and peers are thin. Net asset value fits asset-heavy or financial segments. Early-stage units sometimes sit at invested capital or at a probability-weighted product value, which is common in biotech sum-of-the-parts models.
- Sum the segment enterprise values. The total is the operating enterprise value before corporate and capital-structure adjustments.
A labeled hypothetical shows the arithmetic. A company reports three segments. Segment A earns $100 million of EBITDA and peers trade at 6.0x to 8.0x. Segment B earns $20 million at 14.0x to 20.0x. Segment C earns $10 million at 18.0x to 24.0x.
| Segment | EBITDA ($ millions) | EV / EBITDA low | EV / EBITDA high | Segment EV low ($ millions) | Segment EV high ($ millions) |
|---|---|---|---|---|---|
| A | 100 | 6.0x | 8.0x | 600 | 800 |
| B | 20 | 14.0x | 20.0x | 280 | 400 |
| C | 10 | 18.0x | 24.0x | 180 | 240 |
| Total | 130 | 1,060 | 1,440 |
The blended multiple on $130 million of EBITDA would be about 8.2x to 11.1x. That single range hides that most of the EBITDA sits in the lowest-multiple segment. Sum-of-the-parts valuation keeps the peer sets separate.
Method choice can differ inside the same model. Segment A might be valued on trading comps because drugstore peers are thick. Segment B might use a DCF because growth is forecast-driven and comps are scattered. Segment C might use a precedent range if the live question is a sale of that unit. Mixing methods is normal. Mixing them without saying so in the footnote is what gets challenged in diligence.
From segment values to equity value
Enterprise value for the segments is not the equity value of the stock. The bridge is the same idea as a company-level enterprise value bridge, applied after the sum.
Subtract:
- Gross debt, including capital leases when the bank treats them as debt
- Present value of known contingent or off-balance-sheet claims the model is including (lease dark stores, litigation reserves, pension deficits)
- Minority interests or noncontrolling interests in consolidated subsidiaries
- The present value of unallocated corporate costs, if those costs were not already charged into segment EBITDA
Add:
- Cash and cash equivalents
- Equity-method investments and other non-operating stakes, at a stated value
- Other non-operating assets the segments do not already include
- Deferred tax assets or other tax attributes that are real and transferable, at a stated value
Divide the result by fully diluted shares, usually on the treasury stock method. The output is an implied equity value per share, often shown as a range from the low end of every segment to the high end.
Corporate costs are where models fail in diligence. Costs that disappear if the company is broken up should not be capitalized forever into every segment. Costs that remain at a holding company after a spin still reduce equity value. Temporary separation costs sit between those two. Financial Modeling New York's investment-committee framing of eliminable, holding, and transition costs is the practical split; the Walgreens filing shows the same instinct when Morgan Stanley reduces segment values by debt, dark rent, working capital normalization, opioid liabilities, and a UK pension contribution before adding cash and equity stakes.
A sources and uses table answers a different question at closing: who pays for the deal. The same balance-sheet claims appear in both places. Net debt that must be refinanced in a carve-out shows up in the SOTP bridge and again in the LBO sources column. Treating cash as both a segment asset and a corporate add-on is the usual double-count to catch before the chart is printed.
Conglomerate discount
A conglomerate discount is the gap between the company's trading enterprise value and a higher sum-of-the-parts value. Markets often pay less for a complex group than they would pay for the same businesses as separate listings. Causes include opaque segment disclosure, capital allocated to the wrong division, investors who only want one of the businesses, and the cost of running a corporate center.
Sum-of-the-parts valuation does not prove a discount is "wrong." It measures the gap. Before calling a gap a discount, check whether one segment's multiple or size is distorting the total, and compare the implied equity value with the current share price, the 52-week range, trading comps, and research targets. Closing the gap needs a path: a spin-off, a sale, better disclosure, or a take-private that pays for control. Without a path, the sum is a research view, not a near-term price target. Post-spin trading histories are reminders that pieces can also trade poorly after they leave the parent. The model is an input to that judgment, not the judgment itself.
On the Walgreens proxy, Centerview's illustrative sum-of-the-parts range of about $8.20 to $13.90 sat around the $8.85 unaffected close on December 9, 2024 that the company used for premium disclosure, and around the $11.45 cash consideration. The offer did not need a large conglomerate-discount unlock story to clear the illustrative SOTP band; it sat inside it. Morgan Stanley's wider reference band of $10.85 to $16.90 shows how sensitive the same company can look once segment highs are stacked and a long bridge of liabilities is applied. Two banks, two segment maps, two labels of "reference," and one cash price inside or near both.
Worked example: Walgreens Boots Alliance DEFM14A
Walgreens Boots Alliance agreed to be taken private by Sycamore Partners. The definitive proxy statement on Schedule 14A (Form DEFM14A), filed June 6, 2025, summarizes the fairness analyses Centerview and Morgan Stanley presented to the board. The merger agreement was executed on March 6, 2025. Both banks valued the company with company-level methods. Both also showed a sum-of-the-parts build. The company described the cash consideration as $11.45 per share, about a 29% premium to the $8.85 close on December 9, 2024, the last trading day before media reports of a possible going-private transaction, and described the Per Share Consideration including DAP Rights as a premium of up to 63% to that same price.
Centerview illustrative sum-of-the-parts. Centerview valued U.S. Retail Pharmacy, Boots / International, Shields, USHC ex. Shields, and corporate expense from management projections, applied illustrative multiple ranges to each, and summed them to an enterprise value. The analysis implied about $8.20 to $13.90 per share of company common stock, rounded to the nearest $0.10 (DEFM14A pages 80 to 81). Centerview listed the analysis among "Other Factors" for reference, next to analyst price targets of $7.00 to $15.00, precedent premiums that implied about $10.60 to $12.80, and an illustrative discounted future share price of about $8.10 to $10.40. Its selected public company analysis implied about $4.60 to $12.70, and its discounted cash flow analysis implied about $10.80 to $19.10.
Morgan Stanley sum of the parts comparable companies analysis. Morgan Stanley valued U.S. Retail Pharmacy, International, and U.S. Healthcare for fiscal 2025, combined the low ends of the segment ranges for the floor and the high ends for the ceiling, then reduced the total by gross debt, certain dark rent payments, working capital normalization, potential opioid liabilities and settlements, and the UK pension contribution, and increased it by cash, monetized equity stakes, and other equity investments, each as of November 30, 2024 as provided by management. On fully diluted shares as of March 3, 2025, the implied value was $10.85 to $16.90 per share on an aggregate value to 2025 estimated adjusted EBITDA basis, rounded to the nearest $0.05 (DEFM14A pages 87 to 88). Morgan Stanley labeled the analysis "for reference only" and did not rely on it for the fairness opinion. The bridge list is the practical checklist for any retail or healthcare SOTP: debt is not the only claim above equity.
Where the offer sat. The Per Share Cash Consideration was $11.45. Morgan Stanley's Implied Consideration Value, cash plus the illustrative net present value of the divested asset proceed (DAP) Rights of $1.19 to $1.91, was $12.64 to $13.36. Centerview's Implied Consideration Value for its analyses was $12.35 to $12.85. Cash of $11.45 sits inside Centerview's illustrative SOTP band and toward the low end of Morgan Stanley's reference SOTP band. The DAP-inclusive bands sit higher still. A reader comparing only cash to the SOTP lows and highs without reading the DAP definition will misstate where the full consideration sits.
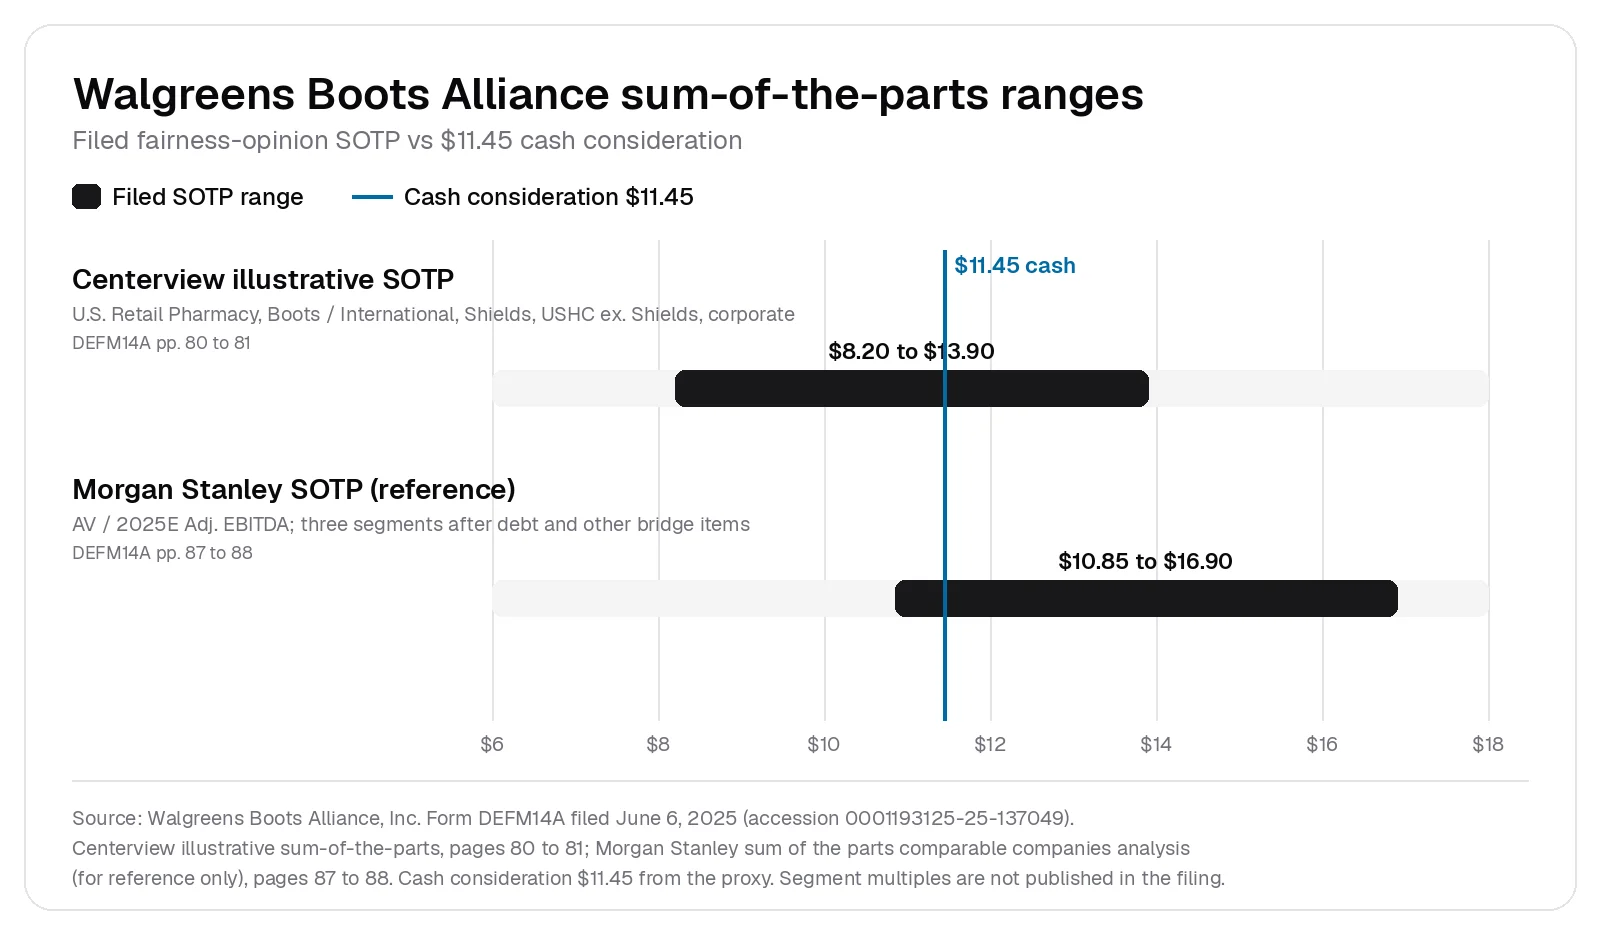
The filing does not publish the segment multiples Centerview or Morgan Stanley used, and it does not publish a segment-by-segment dollar table for either bank. What it does publish is enough for a reader to see how a multi-segment take-private board pack uses sum-of-the-parts valuation: named segments, a stated bridge, a per-share range, and a clear label when the bank treats the method as reference rather than as a pillar of the opinion. The missing segment multiples are not filled in here.
Where sum-of-the-parts sits on a football field
A football field chart puts every valuation method on one page as a horizontal bar. Trading comps, precedent transactions, DCF, and sum-of-the-parts valuation each get a range. The offer price is a vertical line through the chart. Associates build the chart for pitch books and for fairness materials; the board reads whether the offer sits inside, above, or below each method.
On the Walgreens Centerview pages, company-level selected public company analysis implied about $4.60 to $12.70 per share, discounted cash flow about $10.80 to $19.10, and the illustrative sum-of-the-parts about $8.20 to $13.90. Precedent premiums on the unaffected $8.85 price implied about $10.60 to $12.80. Sum-of-the-parts valuation did not replace those methods. It answered a different question: what the equity looks like when U.S. Retail Pharmacy, Boots / International, Shields, and the healthcare units are valued on their own peers instead of on one company multiple.
Reading the field takes one pass top to bottom. If the offer clears trading comps but sits below sum-of-the-parts valuation, the pitch is usually that the market is not paying for the pieces. If the offer sits inside sum-of-the-parts valuation and inside precedent premiums, the board can say the cash price is consistent with both a segment build and recent deal premiums. If discounted cash flow sits well above every other bar, the debate shifts to projections and terminal value, not to segment multiples. The Walgreens Centerview pages show that pattern: DCF was the widest high end, while illustrative SOTP sat closer to the cash price.
Limits of sum-of-the-parts valuation
- Segment disclosure. Public filings rarely give enough clean EBITDA, capital expenditure, and working capital by segment to build a full DCF for every unit. Broader assumptions weaken the range. Wall Street Prep flags the same constraint: conglomerates disclose less than a model wants.
- Allocated costs and shared services. Any allocation key can be argued. Double-counting cash, brand fees, or parent guarantees inflates the sum. Leaving all corporate cost out of every segment inflates it the other way.
- Synergies across divisions. Cost savings that exist only because the segments sit together disappear in a break-up. A sum that keeps those savings overstates separable value. Shared customers and shared brands create the same problem on the revenue line.
- Tax and friction on separation. Spin-offs, carve-outs, and asset sales create tax, stranded costs, transition service agreements, and execution risk. Illustrative SOTP ranges in fairness opinions often exclude those frictions unless the bank models them. Investopedia notes that spinoff tax effects are commonly left out of simple SOTP math.
- Control and liquidity. Segment multiples from minority trading comps are not the same as what a buyer pays for control of a division, and a carved-out company may trade with less liquidity than the peers used in the model.
- No event path. If management will not sell or separate the pieces, a higher sum is not a catalyst by itself. Practitioner commentary on large technology platforms often makes the same point: without a monetization path and a workable corporate-cost structure for each unit, a paper sum overstates what equity holders can realize.
Those limits are why banks label some sum-of-the-parts pages "illustrative" or "for reference only," as both Centerview and Morgan Stanley did in the Walgreens proxy.
Sum-of-the-parts in investment banking interviews
Interviewers ask for a walk-through, not a memorized slogan. A clean answer names the steps and why the method fits:
- Identify the segments that have different peers or risk.
- Pick a method per segment (comps, precedents, DCF, or net asset value).
- Sum segment enterprise values.
- Bridge to equity with net debt, corporate costs, minorities, and non-operating assets.
- Divide by diluted shares and compare with the share price or the offer.
Then say when you would use it: conglomerate, spin pitch, break-up defense, or a fairness pack on a multi-segment target. If the interviewer pushes on corporate costs, separate costs that leave with a sale from costs that stay at the parent. If they ask how it appears in a pitch book, say it is usually one bar on the football field and one backup slide with the segment table.
Common follow-ups are easy to miss. "Would you apply a conglomerate discount on top of the sum?" means: after you have used segment peers, do you still haircut the total because the stock remains a complex holding company. "What breaks the analysis?" means: bad segment data, wrong peers, ignored tax on a spin, or double-counted cash. "How is this different from trading comps?" means: comps value the whole company against one peer set; sum-of-the-parts valuation builds the company from several peer sets. Keep the answers short and tied to a real process, not to a slogan pair.
How private equity uses sum-of-the-parts
A private equity sponsor that wants one division of a conglomerate is not underwriting the parent's earnings per share. The sponsor underwrites a leveraged buyout (LBO) of the piece: purchase price for that segment, debt capacity on that segment's cash flow, the equity check, hold-period value creation, and exit multiple. Sum-of-the-parts valuation on the parent helps the sponsor see whether the seller's ask for the piece is rich relative to the parent's implied value for that segment, and whether a carve-out leaves stranded costs at the parent that will show up in the negotiation.
The diligence package looks different from a sell-side SOTP slide. Associates rebuild segment EBITDA with add-backs they believe, re-cut working capital as if the unit stood alone, and size the one-time costs to separate systems, contracts, and employees. Transition service agreements with the parent can mask how expensive independence will be in year two. Those items rarely appear in a fairness-opinion SOTP table, but they decide whether the LBO clears the fund's return hurdle.
Sell-side sum-of-the-parts valuation in a fairness opinion answers a board question about the whole equity. Buy-side work on a carve-out answers a fund question about returns on the assets being bought. Accretion dilution analysis belongs to strategic buyers that report EPS. A sponsor's scoreboard is internal rate of return (IRR) and multiple on invested capital (MOIC), not pro forma EPS. When a strategic buyer competes with a sponsor for the same division, both may start from a similar segment enterprise value, then diverge on financing, tax, and the value of keeping the division inside a larger group.
That is also why take-privates of multi-segment retailers still show sum-of-the-parts valuation in the proxy: the board is comparing an offer for the whole company with what the pieces imply, while the sponsor is modeling control of the whole (or of selected assets after closing) as a leveraged investment. Going private processes put both views in the same document without making them the same analysis.
Common questions
What does sum-of-the-parts mean in valuation? It means valuing each business segment separately and adding the results, then bridging from enterprise value to equity value.
What does SOTP mean? SOTP is the usual abbreviation for sum of the parts (or sum-of-the-parts) valuation.
How do you calculate a sum-of-the-parts valuation? Identify segments, value each with an appropriate method, sum to enterprise value, adjust for net debt and other non-operating items, and divide by diluted shares.
What are the top valuation methods next to SOTP? For most coverage and M&A processes the core set is trading comps, precedent transactions, and discounted cash flow. Sum-of-the-parts valuation is added when the company has distinct segments.
Does a higher sum-of-the-parts value mean the stock is cheap? Only if you also believe the segments are valued on the right peers and that something will cause the market to pay for those segments separately. Without a separation path, the gap can persist.
Can private companies use sum-of-the-parts valuation? Yes. The same segment build applies when a private group needs a price for one division in a sale, spin, or financing, or when an appraiser has to defend segment values rather than a single company multiple.
Sources
Walgreens Boots Alliance, Inc., definitive proxy statement on Schedule 14A (Form DEFM14A), filed June 6, 2025, accession 0001193125-25-137049, https://www.sec.gov/Archives/edgar/data/1618921/000119312525137049/d942554ddefm14a.htm (Centerview illustrative sum-of-the-parts, pages 80 to 81; Morgan Stanley sum of the parts comparable companies analysis, pages 87 to 88; cash consideration and Implied Consideration Value definitions in the opinions and proxy Q&A).
Related posts
Related posts

Accretion dilution analysis tests whether an acquisition raises or lowers the buyer's earnings per share. The inputs, the calculation, the P/E shortcut, breakeven synergies, and Kimberly-Clark's filed pro forma EPS for Kenvue.

Precedent transaction analysis values a company from the multiples buyers paid for similar companies. Screening, data sources, multiples, the control premium, and two banks' filed tables from the Walgreens take-private.

A pitch book is the presentation an investment bank uses to win a mandate. Types, the pages in order, the valuation pages, who builds each part, and real bank decks filed with the SEC.