
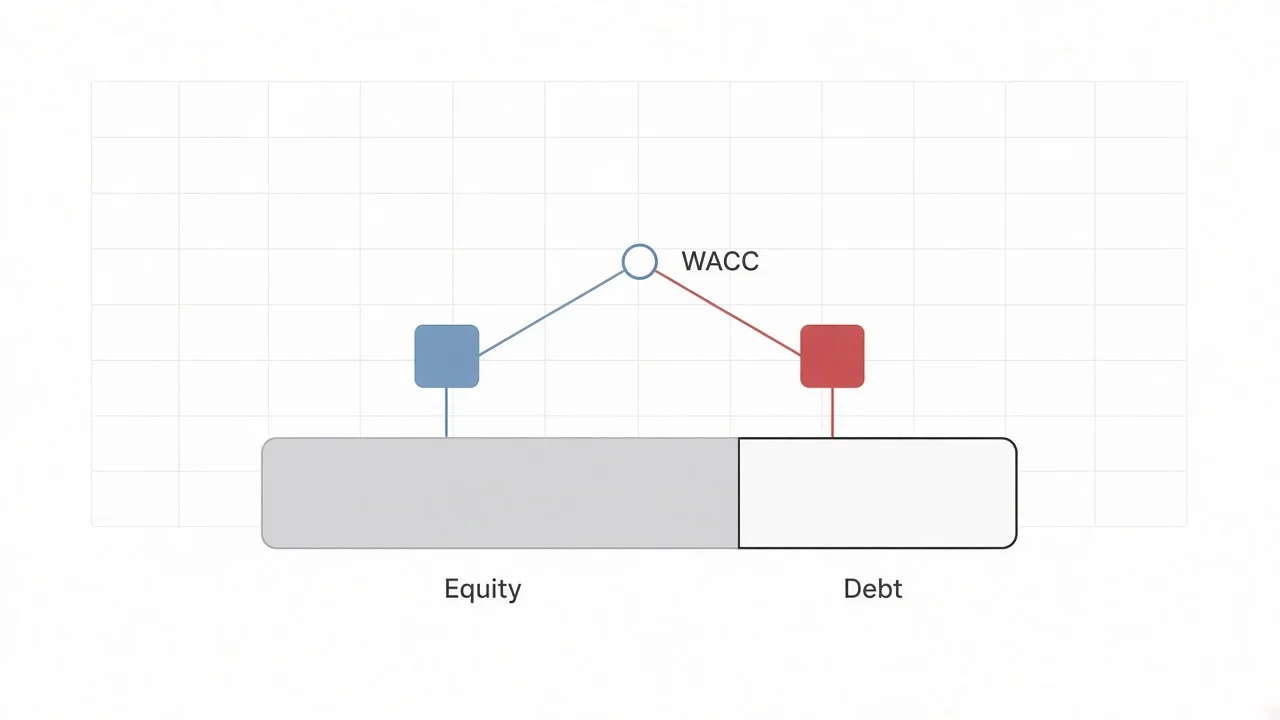
The weighted average cost of capital (WACC) is the average return a company has to offer its lenders and shareholders, weighted by how much of its financing each group provides, with the cost of debt reduced for the tax saving on interest. It is the discount rate in a discounted cash flow (DCF) valuation and the minimum return an average-risk investment must earn to add value. The formula is simple, and the inputs are where analysts disagree. On February 17, 2026, the two banks advising the special committee of Mister Car Wash on a $7.00-a-share offer from Leonard Green & Partners, the private equity firm that already owned two-thirds of the company, each presented a WACC built from market data as of February 13. Centerview Partners arrived at 10.3%, using three peers' betas, a 7.4% historical equity risk premium and a 1.1% size premium. BofA Securities arrived at 9.7% to 11.6%, using the company's own beta, a 5% to 7% premium and no size premium. Replace Centerview's premium with the 5.0% that Kroll recommended at the time and the same build gives 8.9%.
What WACC is
A company is financed by two groups of investors. Lenders are paid interest and get their money back first. Shareholders are paid only from what is left, so they demand a higher expected return. WACC blends the two required returns in proportion to how much of the company each group finances. A company funded 75% by equity that investors expect to return 11.8% a year and 25% by debt that costs 5.9% after tax has a WACC of about 10.3%. That is the return its operating assets must earn, on average, to pay both groups what they require.
A WACC of 12% means that investors in the business, taken together, expect 12% a year for the risk they bear. A project or acquisition that earns 12% on the capital it uses leaves them where they were; one that earns 15% creates value, and one that earns 9% destroys it even if it reports a profit. The same comparison drives return on invested capital (ROIC) analysis. A company whose ROIC stays above its WACC creates value as it grows, and one whose ROIC stays below it destroys value as it grows. A WACC of 15% means investors see more risk, so future cash flows are worth less today.
WACC is not the average interest rate on a company's loans, which is only the cost of debt. Nor is the cost of equity the company's expected earnings growth. It is the return shareholders require for the risk, and since no market quotes it, it has to be estimated. Retained earnings carry the same cost as new shares, because shareholders could have earned that return elsewhere.
WACC has four main uses:
- Discount rate. In a DCF, unlevered free cash flow, the cash available to all investors, is discounted at the WACC to give enterprise value.
- Hurdle for capital spending. Corporate finance teams accept projects with a positive net present value at the WACC, and add a premium for projects riskier than the company as a whole.
- Value creation test. Analysts compare ROIC with WACC, and acquirers compare a target's expected return with their own WACC.
- Fairness and fair value. Banks use WACC in fairness opinions, and accountants and auditors use it to test goodwill and value private holdings.
Inside a company, treasury or corporate finance usually owns the number. In the Association for Financial Professionals' (AFP) 2026 Cost of Capital Survey of 295 corporate practitioners, published March 10, 2026, treasury calculated the WACC at 34% of organizations and corporate finance at 32%. In the same survey, 62% of organizations used their calculated cost of capital as the standard hurdle rate for investments, and 38%, particularly smaller or privately held firms, set the hurdle above it.
The WACC formula
WACC = E / V × Re + D / V × Rd × (1 − t)
- E is the market value of equity and D the market value of debt, or a target mix of the two. V is E + D.
- Re is the cost of equity, usually estimated with the capital asset pricing model (CAPM).
- Rd is the pre-tax cost of debt, the yield the company would pay to borrow today.
- t is the marginal tax rate, because interest is deductible.
A company with preferred stock adds a third term, P / V × Rp, where Rp is the preferred dividend yield. Preferred dividends are not tax-deductible, so there is no (1 − t). Convertible bonds and other hybrids are usually split into their debt and equity parts. A company with several layers of debt, such as a senior bank loan and a subordinated note, or a seller note in a small acquisition, can give each layer its own weight and rate, though most analysts blend them into one cost of debt.
The cost of equity comes from CAPM, plus any premiums the analyst adds:
Re = risk-free rate + beta × equity risk premium + size premium + company-specific premium (+ country risk premium)
A simple worked case, with Centerview's Mister Car Wash inputs:
| Input | Value |
|---|---|
| Risk-free rate (20-year Treasury) | 4.6% |
| Beta (relevered) | 0.83 |
| Equity risk premium | 7.4% |
| Size premium | 1.1% |
| Cost of equity: 4.6% + 0.826 × 7.4% + 1.1% | 11.8% |
| Pre-tax cost of debt | 8.0% |
| After-tax cost of debt: 8.0% × (1 − 26%) | 5.9% |
| Equity / capital | 74.6% |
| Debt / capital | 25.4% |
| WACC: 74.6% × 11.81% + 25.4% × 5.92% | 10.3% |
Equity supplies three-quarters of the capital and contributes 8.8 points of the 10.3%. Debt contributes 1.5 points.
How to calculate WACC, step by step
- Set the capital weights. Measure equity at market value (share price times diluted shares) and debt at market value, usually close to book value. If the capital structure is about to change, as in a sale, use a target mix from comparable companies.
- Estimate the cost of debt. Use the yield on the company's traded bonds, the rate on new bank debt, or a rating-based spread over the risk-free rate, then multiply by one minus the marginal tax rate.
- Pick the risk-free rate. Use a government bond yield in the cash flows' currency on the valuation date. In the US, the data published by Aswath Damodaran of NYU Stern is built on the 10-year Treasury and Kroll's on the 20-year, which both Mister Car Wash banks used.
- Estimate beta. Use the company's own beta if it is reliable; otherwise unlever listed peers' betas, take the median and relever it at the target capital structure.
- Add the equity risk premium and any other premiums. Take the equity premium from a named source that matches the risk-free rate, then add size, country or company-specific premiums where they apply.
- Combine. Weight the two costs by their shares of capital and present a range. The Mister Car Wash banks ran their DCFs across 1.5 to 2 points of discount rate.
The 20-year Treasury yield, which Centerview rounded to 4.6% on February 13, 2026 (4.64% on the US Treasury's daily par yield curve), was 5.52% on November 13, 2026. Holding every other input fixed, that 0.88-point rise alone lifts the cost of equity by 0.88 points and Centerview's WACC by about 0.66 points, before any change in the company's borrowing cost.
Cost of equity and beta: unlevering and relevering
Beta measures how much a stock tends to move with the market. A beta of 0.83 means the shares have tended to rise or fall about 8.3% when the market moves 10%. Cyclical businesses tend to have betas above 1 and regulated or staple businesses below it; in Damodaran's cost of capital by industry, with data as of January 2026, US semiconductor companies averaged 1.52 and general utilities 0.24. In CAPM, beta is the only input specific to the company, and it is the one analysts argue about most, because it is estimated from past prices and the estimate depends on the period, the frequency and the index. For a single stock the regression usually explains a small share of the price moves, so the estimate carries a wide margin of error, which is one reason analysts prefer a median across several peers.
Mister Car Wash had at least four betas on file in February 2026:
| Beta | Source | Value |
|---|---|---|
| Company, two-year weekly, unaffected date before takeover speculation (October 17, 2025) | Bloomberg adjusted, in Centerview's book | 1.08 |
| Company, two-year weekly, February 13, 2026 | Bloomberg adjusted, in Centerview's book | 0.95 |
| Company, weekly since its June 2021 IPO | Bloomberg adjusted, in BofA's book | 1.31 |
| Peer median, unlevered and relevered | Centerview's WACC | 0.83 |
The fall from 1.08 to 0.95 illustrates why bankers distrust a target's own beta during a sale. Once investors expect a takeover, the stock tends to track the expected deal price rather than the market, so its measured beta drops. All four figures are adjusted betas. Bloomberg's adjustment pulls the raw regression estimate toward 1.0, on the evidence that betas drift toward the market average over time.
The industry beta approach avoids the company's own price history. Each peer's levered beta reflects both its business risk and its debt, so the debt is stripped out first:
Unlevered beta = levered beta / [1 + (1 − t) × D / E]
Relevered beta = unlevered beta × [1 + (1 − t) × target D / E]
Centerview's peers, with the 26% tax rate used in its book:
| Peer | Levered beta | Debt / equity | Unlevered beta (filed) | Unlevered at 26%, recomputed |
|---|---|---|---|---|
| Valvoline | 0.84 | 34% | 0.66 | 0.67 |
| Driven Brands | 0.87 | 62% | 0.58 | 0.60 |
| Monro | 0.92 | 6% | 0.88 | 0.88 |
| Median | 0.87 | 34% | 0.66 |
The recomputed figures for Valvoline and Driven Brands come out 0.01 to 0.02 higher than the filed ones, most likely because Centerview used unrounded leverage or each peer's own tax rate. Its footnote gives the same formula. Relevered at the peer median debt-to-equity ratio of 34%, the median unlevered beta of 0.66 becomes 0.66 × (1 + 0.74 × 0.34) = 0.83. Centerview's sensitivity grid, which varies the unlevered beta from 0.60 to 0.90 and debt-to-equity from 10% to 40%, reproduces within 0.1 point with the same formula.
The choice of beta moves the answer. Using Mister Car Wash's own unaffected unlevered beta of 0.76 instead of the peer median, relevered the same way, gives a beta of 0.95, a cost of equity of 12.7% and a WACC of 11.0%, 0.7 points above Centerview's figure. BofA's 1.31 is higher still. The peer approach is standard in fairness work because it rests on several companies' prices rather than one, and it is the only option for a private company. The peers are usually the same set used for comparable company analysis.
The formula assumes debt carries no market risk and stays at a constant ratio to equity. Some analysts add a debt beta for highly levered companies. Alternatives to CAPM exist, including multi-factor models, a dividend growth model (next year's dividend / price + growth) for steady payers, and the company's own bond yield plus a premium for equity risk. CAPM is still what 83% of the organizations in the AFP survey use for the cost of equity and what fairness opinions almost always disclose. Textbooks also raise the cost of newly issued shares for underwriting fees, known as flotation costs; fairness opinions rarely do.
Which equity risk premium to use
The equity risk premium (ERP) is the extra annual return investors expect from stocks over the risk-free bond. It cannot be observed, and the sources differ by more than two points. Each is measured against a specific risk-free rate, so the premium and the bond have to be paired.
| ERP source | Premium | Paired risk-free rate | Mister Car Wash WACC on Centerview's build |
|---|---|---|---|
| Kroll long-horizon historical (Centerview's choice) | 7.4% | 20-year Treasury, 4.6% | 10.3% |
| BofA Securities estimate, range | 5.0% to 7.0% | 20-year Treasury, 4.6% | 8.8% to 10.1% |
| Kroll recommended US ERP | 5.0% | 20-year Treasury spot, 4.64% | 8.9% |
| Damodaran implied ERP, February 1, 2026 | 4.25% | 10-year Treasury, 4.26% | 8.1% |
The figures in the last column hold Centerview's beta, size premium, cost of debt and weights fixed and change only the premium and its paired bond.
The three approaches answer different questions. A historical premium, such as Kroll's long-horizon figure, is the average excess return stocks have earned over long-term government bonds in past data. Kroll's recommended premium is a forward-looking judgment, reaffirmed at 5.0% for US dollar discount rates as of September 2, 2026, after first taking effect on September 2, 2025. Damodaran publishes an implied premium every month, calculated as the internal rate of return that equates the S&P 500's level with its expected dividends and buybacks, minus the 10-year Treasury yield. His monthly series put it at 4.25% on February 1, 2026 and 3.79% on November 1, 2026. With the 10-year yield of 4.94% used in that update, that implies an expected market return of 8.73%.
The risk-free rate that goes with Kroll's premium changed in September 2026. Since 2022 Kroll had recommended using the higher of the spot 20-year Treasury yield and a normalized rate of 3.5%. In a September 10, 2026 memo, Kroll dropped the normalized floor and now recommends the spot rate on the valuation date. The 20-year yield stayed between 4.57% and 5.71% from January to mid-November 2026, well above the floor, so the change did not alter this year's arithmetic.
The usual error is mixing sources, such as Damodaran's 10-year-based premium added to a 20-year yield. Both banks' books name their premium source without arguing for it, and on this deal the choice was worth 2.2 points of WACC.
Size, company-specific and country premiums
CAPM tends to understate the returns small companies have historically earned, so many practitioners add a size premium. Kroll publishes size premiums by market-capitalization band, and two 2026 fairness analyses drew on its data:
- Centerview added 1.1% for Mister Car Wash, "per Kroll based on current market capitalization" of about $2.0bn.
- Marshall & Stevens added 2.66% for FONAR, a maker of MRI scanners that also manages diagnostic imaging centers, with a market value of about $97m, from Kroll's micro-cap data.
BofA added none for Mister Car Wash. The size premium is contested. Critics argue the small-company excess return is unstable across periods and reflects illiquidity more than risk.
A company-specific risk premium is a judgment that the projections or the business carry risk the beta does not capture. CAPM leaves such risk out on purpose, because an investor holding many stocks can diversify it away, so the premium is common in small-company valuation and contested in theory. Marshall & Stevens added 4.0% for FONAR, citing revenue concentration in personal-injury-related imaging, the possible repeal of Florida's personal injury protection (PIP) auto insurance laws and credit exposure to one insurer, American Transit. Neither Mister Car Wash bank added one. Valuation firms working on small or private companies often do.
A country risk premium covers sovereign and political risk for operations in emerging markets. Damodaran's country risk table, dated January 5, 2026, starts from a mature-market premium of 4.23% and adds a premium scaled from each country's sovereign default spread:
| Country | Moody's rating | Country risk premium | Total ERP |
|---|---|---|---|
| Germany | Aaa | 0.00% | 4.23% |
| United States | Aa1 | 0.23% | 4.46% |
| Mexico | Baa2 | 2.46% | 6.69% |
| India | Baa3 | 2.85% | 7.08% |
| Brazil | Ba1 | 3.24% | 7.47% |
The United States carries a small premium in Damodaran's table because Moody's downgraded its rating to Aa1 in May 2025. The country premium should follow where a company earns its revenue, not where it is listed; a US-listed company with half its sales in Brazil carries part of Brazil's premium.
Cost of debt and the tax shield
The cost of debt is what the company would pay to borrow today, not the coupon on debt it issued years ago. For a company with traded bonds, that is their yield to maturity. Both Mister Car Wash banks used a forward-looking rate. Centerview took 8.0%, its estimate of the company's "marginal cost of unsecured debt," and BofA took 8.25%, "based on market estimates for new unsecured 10-year debt." A promised yield on risky debt overstates the expected cost a little, because some of the yield compensates for default, but the gap is small for investment-grade borrowers and is usually ignored. For floating-rate loans, the long-term borrowing rate is a better measure than today's floating rate, because the loan will be rolled over across the life of the cash flows.
A company without traded debt can be given a synthetic rating from its interest coverage. Damodaran's ratings table for large non-financial companies, as of January 2026, maps interest coverage, operating income divided by interest expense, to a spread over Treasuries:
| Operating income / interest | Synthetic rating | Spread | Pre-tax cost of debt at the November 13, 2026 10-year yield of 5.15% |
|---|---|---|---|
| 2.5x to 3.0x | Baa2 / BBB | 1.11% | 6.26% |
| 2.0x to 2.25x | Ba2 / BB | 1.84% | 6.99% |
| 1.5x to 1.75x | B2 / B | 3.21% | 8.36% |
Interest is tax-deductible, so the after-tax cost is Rd × (1 − t). At a 26% marginal rate, Centerview's 8.0% becomes 5.9% and BofA's 8.25% becomes 6.1%. The tax rate should be the marginal rate the company will pay on its last dollar of income in the long run, not the effective rate in a single year. The Mister Car Wash projections in Centerview's book carry effective tax rates of 1.1% to 2.8% from 2026 to 2030 and 26% in the terminal year. Centerview used 26% in the WACC and the low near-term rates in the cash flows, which keeps the two consistent. BofA's book labels the same low rates as including the company's tax asset. Tax losses carried forward belong in the cash flows, as lower cash taxes, or in a separate value for the tax asset; they do not lower the rate in the WACC.
The US tax shield is also capped. Under section 163(j) of the Internal Revenue Code, business interest is deductible only up to business interest income plus 30% of adjusted taxable income. The 2025 tax law known as the One, Big, Beautiful Bill (P.L. 119-21) restored the add-back for depreciation and amortization for tax years beginning after December 31, 2024, which brings adjusted taxable income back close to earnings before interest, tax, depreciation and amortization (EBITDA), according to the IRS's fact sheet on the limitation. Interest above the cap carries forward to later years. Many other countries limit interest deductions in a similar way, through thin-capitalization rules tied to leverage or caps tied to earnings, so the tax rate in a non-US WACC needs the same check. For a company with $100m of EBITDA and $600m of debt at 8.25%, interest of $49.5m exceeds the $30m cap, so $19.5m is not deductible this year. At a 26% rate, the after-tax cost of that debt is about 7.0% instead of 6.1% until the disallowed interest is used. Heavily levered buyouts are where the cap binds.
Market, book and target weights
Weights should reflect what investors' claims are worth today, so equity is measured at market value. Book equity understates it for most profitable companies and overstates the weight of debt. Mister Car Wash's balance sheet showed $1,133m of equity at the end of 2025 against $810m of debt, which puts debt at about 42% of book capital. At the $7.00 offer, its equity was worth $2,355m on Centerview's figures, and debt was about a quarter of the total.
Debt in the weights means interest-bearing debt: bank loans, bonds, finance leases, short-term borrowings and the current portion of long-term debt. Accounts payable, deferred revenue and other operating liabilities carry no interest and stay out. Operating leases can go either way as long as the cash flows match: if the projections deduct rent, the lease liability stays out of debt. Mister Car Wash's adjusted EBITDA adds back only non-cash rent, so cash rent is already an operating cost, and both banks used $810m of debt, which the company's information statement describes as debt including finance leases. Book value is usually close enough to the market value of debt, except when rates have moved a long way since it was issued; a fixed-rate bond issued at 3% trades well below par when yields are above 5%, and its market price is then the better measure. A company with more cash than debt has negative net debt, which would give debt a negative weight in a net-debt build, so analysts usually use gross debt for such a company.
Bankers in a sale often prefer a target structure to the company's own. Centerview relevered at the peer median debt-to-equity ratio of 34%, a 25.4% debt weight, rather than Mister Car Wash's own debt-to-equity ratio of 40% on February 13 or 53% before takeover speculation began. BofA used the company's current net debt to net capital, 28.9%, netting $28m of cash against $810m of debt. Either is defensible if the same definition runs through the beta and the weights. A gross-debt beta with net-debt weights is not.
The weight on debt matters less than it appears, because more debt also raises the relevered beta. In Centerview's grid, raising debt-to-equity from 10% to 40% at an unlevered beta of 0.75 lowers the WACC only from 11.1% to 10.9%. Cheaper after-tax debt replaces equity, but the remaining equity becomes riskier. Past a moderate level, the cost of debt jumps as coverage weakens and the 163(j) cap binds, so borrowing heavily to lower WACC on paper usually raises both costs. Each additional dollar of new capital also tends to cost more than the last, which economists call the marginal cost of capital.
WACC example: two banks, one company, one week
Mister Car Wash, which describes itself as the largest national car wash brand, with 548 locations in 21 states at the end of 2025, agreed on February 17, 2026 to be taken private by Leonard Green, which owned 66.78% of the shares before the deal, at $7.00 a share. The offer valued the equity at $2,355m and the enterprise at $3,137m, 8.7 times the $360m of 2026 EBITDA in Centerview's offer metrics. The special committee hired two banks, and the going-private filing includes both banks' February 17 discussion materials, Centerview's and BofA's, with their WACC pages. The two books share the company, the management projections and the market data date:
| Input | Centerview Partners | BofA Securities |
|---|---|---|
| Risk-free rate | 20-year Treasury, 4.6% | 20-year Treasury, 4.6% |
| Beta | 0.83, peer median unlevered beta of 0.66 relevered at 34% debt-to-equity | 1.31, company's Bloomberg adjusted beta since its 2021 IPO, levered at its average capital structure over that period |
| Equity risk premium | 7.4%, Kroll long-horizon historical | 5.0% to 7.0%, BofA estimate |
| Size premium | 1.1%, Kroll | None |
| Cost of equity | 11.8% | 11.2% to 13.8% |
| Pre-tax cost of debt | 8.0%, marginal unsecured | 8.25%, new unsecured 10-year |
| Tax rate | 26% | 26%, marginal statutory |
| After-tax cost of debt | 5.9% | 6.1% |
| Debt weight | 25.4% of capital, peer median | 28.9% net debt to net capital, current |
| WACC | 10.3% | 9.7% to 11.6% |
| Discount rates used in the DCF | 10.0% to 12.0%, mid-year convention | 10.0% to 11.5%, year-end convention |
| DCF value per share | $6.40 to $9.25 (exit at 7.5x to 9.5x EBITDA) | $6.10 to $8.75 (exit at 7.0x to 9.0x) |
Both builds reproduce from their inputs. Centerview's arithmetic is in the worked case above. BofA's low case is 4.6% + 1.31 × 5.0% = 11.15% for equity and 71.1% × 11.15% + 28.9% × 6.11% = 9.69% overall; its high case at a 7.0% premium gives 13.77% and 11.55%.
The banks reached similar answers by opposite routes. Centerview paired a low beta from peers with a high historical premium and a size premium. BofA paired a high company beta with a lower premium range and no size premium. The product of beta and premium, the term that does most of the work in CAPM, is 6.1 points in Centerview's build and 6.6 to 9.2 points in BofA's. Changing one input at a time shows how much each choice is worth:
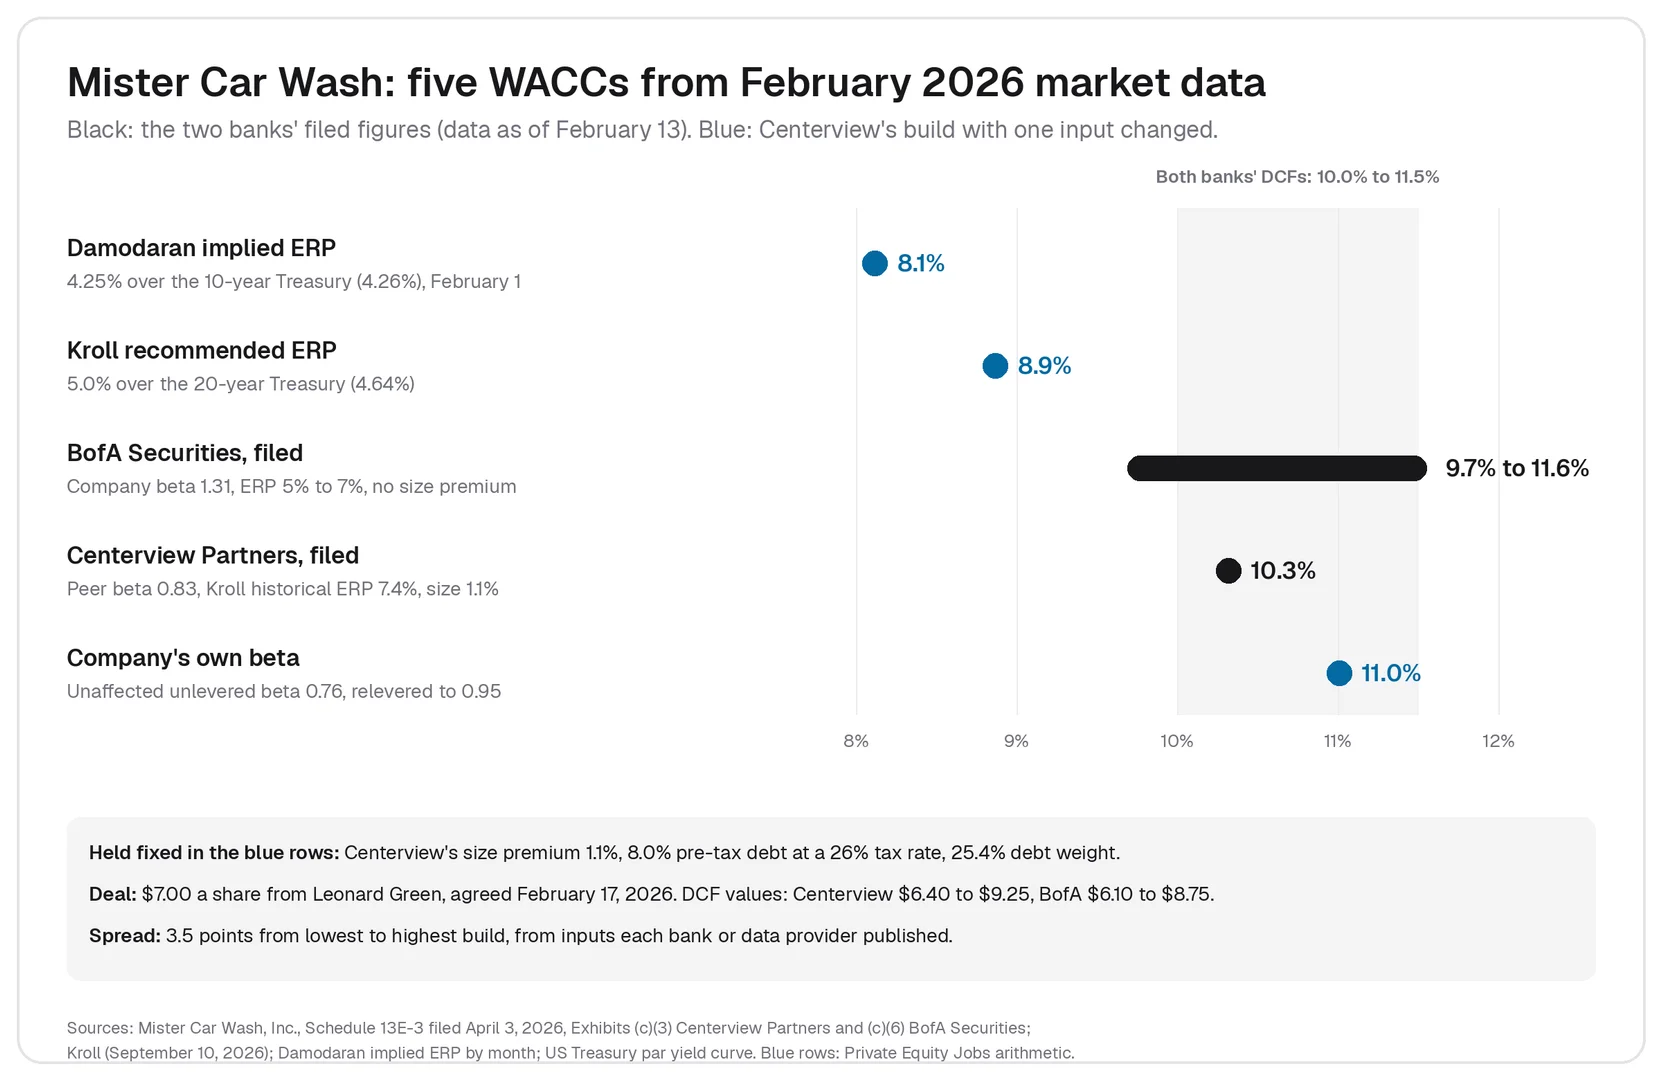
From the lowest build to the highest is about 3.5 points of WACC, and a practitioner could defend the inputs in each case. Both banks then ran their DCFs at 10% to 11.5% or 12%, a range that covers most of the spread, and both produced a value range that contained the $7.00 price. In Centerview's DCF at an 8.5x exit multiple, a point on the discount rate moves value by about 40 to 45 cents a share, from $8.20 at 10% to $7.80 at 11% and $7.35 at 12%. A DCF that ends in an exit multiple is less sensitive to the WACC than one that ends in a perpetual growth rate, because the multiple fixes most of the terminal value.
WACC for a private company
A private company has no share price, so it has no market beta and no market value of equity. Analysts borrow both from listed peers, relevering an unlevered peer beta at a target debt-to-equity ratio and using a target capital structure in place of the company's own. That also solves the circularity in private-company WACC, where the equity weight depends on the equity value the WACC is meant to find. Some valuation guides iterate, recomputing the weights from each new value until WACC stops changing. Using a target structure from peers skips the loop.
FONAR, a Nasdaq micro-cap taken private in June 2026 by an acquisition group controlled by Timothy Damadian, shows the private-company build at full strength. Marshall & Stevens, the special committee's valuation adviser, disclosed every input in FONAR's April 16, 2026 proxy statement:
| Input | FONAR, Marshall & Stevens |
|---|---|
| 20-year Treasury | 4.74% |
| Relevered beta, from guideline companies | 0.77 |
| Equity risk premium, Kroll Cost of Capital Navigator 2025 | 6.26% |
| Size premium, Kroll micro-cap | 2.66% |
| Company-specific risk premium | 4.0% |
| Cost of equity | 16.2% |
| After-tax cost of debt, BBB yields, 27% tax | 4.6% |
| Debt / capital, from guideline companies | 15% |
| WACC | 14.5% |
The arithmetic holds: 4.74% + 0.77 × 6.26% + 2.66% + 4.0% = 16.22%, and 85% × 16.22% + 15% × 4.6% = 14.48%. FONAR had no interest-bearing debt and $54m of cash, so the 15% debt weight is a target taken from listed peers, the structure a buyer could put in place, not the company's own. The cost of debt came from BBB-rated bond yields rather than any loan FONAR had.
The two premiums do most of the work. Together they are 6.66 points, 41% of the cost of equity. Without the 4.0% company-specific premium, the WACC falls to 11.1%; without the size premium as well, to 8.8%. In a Gordon growth terminal value at FONAR's 2.0% growth, those rates imply terminal multiples of cash flow of about 8.0x, 11.0x and 14.7x. Marshall & Stevens concluded a fair market value of $14.48 to $15.52 a share, on a controlling and marketable basis, weighting its DCF at 50%, a guideline public company method at 25% and a liquidation analysis at 25%, against the $19.00 offer. Because the premiums lower the value, they made the $19.00 offer look generous by comparison. The same arithmetic can work against minority shareholders when an offer is low, because a high discount rate makes a low price look fair.
For a management buyout or any deal where the buyer controls the information, the company-specific premium is the input to question first, because it rests on judgment rather than market data. A private company's cost of debt can come from a recently set bank rate or a synthetic rating; Damodaran's spreads are for large non-financial companies, so a small borrower's actual loan quotes are the better check.
WACC in private equity
A buyout fund's target return is not a WACC. It is a levered equity return, after financing, fees and the risk of a concentrated position. WACC is the return the operating assets must earn for all investors at a normal capital structure. A leveraged buyout (LBO) model links the two. It takes the company's cash flows, adds the debt package and solves for the price that gives the fund's equity its target internal rate of return.
The Mister Car Wash filings make the link concrete. On management's plan, buying the whole enterprise at the $7.00 price ($3,137m) and selling it at 8.5 times 2030 EBITDA gives an unlevered internal rate of return of about 13.0%, measured from the end of 2025 with mid-year cash flows. That is 2.7 points above Centerview's 10.3% WACC. At a 7.5x exit the unlevered return falls to 10.5%, about the WACC; at 9.5x it rises to 15.2%. These figures are recomputed from Centerview's filed cash flows and match its DCF values within $3m.
Debt turns that unlevered return into a higher equity return, as long as the asset earns more than the after-tax cost of debt. Holding leverage constant, the equity return is roughly the unlevered return plus the spread over the after-tax cost of debt times debt-to-equity. With BofA's 6.1% after-tax cost of debt, a 13.0% unlevered return becomes about 16.4% at 0.5 times debt-to-equity and about 19.8% at 1.0 times. The same leverage that lifts the expected return raises the equity's risk, which is why the cost of equity in a WACC rises with debt too. A price that is fair at the WACC can still fail a fund's return test, and a price that passes the return test on an optimistic exit multiple can be above fair value.
Three other places WACC comes up in private equity:
- Portfolio valuations. When a fund marks a portfolio company to fair value each quarter with a DCF, the discount rate should be a market participant's WACC, not the fund's target return.
- Fund hurdle rates. The preferred return limited partners must receive before the manager earns carry is a contract term on the fund's cash flows, not a discount rate for any deal.
- Going-private fairness. In a going private deal led by a controlling sponsor, like Leonard Green at Mister Car Wash, the filings disclose the special committee's WACC build, one of the first inputs minority shareholders can test.
Common WACC mistakes
- Book weights. Using balance-sheet equity overstates the weight of cheap debt for most profitable companies.
- Coupon instead of yield. The cost of debt is today's borrowing rate, not the rate on debt issued years ago.
- Forgetting the tax shield, or overstating it. Interest is deductible, but in the US only up to the section 163(j) cap, and only when the company pays tax.
- Mismatched ERP and risk-free rate. A premium measured against the 10-year Treasury added to a 20-year yield, or the reverse.
- Stale inputs. A WACC built in February on a 4.64% 20-year yield is out of date when the yield is 5.52%.
- Using the target's own beta during a sale. Once deal speculation sets in, the stock tracks the offer, and its beta falls.
- Unlevering and relevering at different definitions. Gross debt in the beta and net debt in the weights, or market values in one and book values in the other.
- Stacking premiums without evidence. A size premium, a company-specific premium and a pessimistic forecast can count the same risk three times.
- Mixing nominal and real. A WACC built from Treasury yields includes expected inflation, so the cash flows it discounts must include inflation too.
- Using the WACC for levered cash flows. Cash flow after interest belongs to shareholders and is discounted at the cost of equity.
- False precision. A WACC to two decimals hides the range that defensible inputs produce.
WACC interview questions
WACC questions are standard in banking and private equity interview, usually right after "walk me through a DCF." The short answer: WACC is the blended required return of a company's debt and equity, weighted by market value, with debt on an after-tax basis; the cost of equity comes from CAPM. The follow-ups test whether the candidate understands the inputs:
- Why is the cost of equity higher than the cost of debt? Shareholders are paid after lenders and have no fixed claim, so they bear more risk; interest is also tax-deductible and dividends are not.
- What happens to WACC if a company adds debt? At first it usually falls a little, because after-tax debt is cheaper than equity, but the relevered beta rises with it; in Centerview's grid, moving from 10% to 40% debt-to-equity lowers WACC by only 0.2 to 0.3 points. Past a point, the cost of debt jumps and WACC rises.
- How do you unlever and relever beta? Divide each peer's levered beta by 1 + (1 − t) × D/E, take the median, then multiply by 1 + (1 − t) × the target D/E. Valvoline's 0.84 at 34% debt-to-equity and a 26% tax rate unlevers to about 0.67.
- Which risk-free rate would you use? A government bond in the same currency as the cash flows, at a maturity matched to the ERP source: the 20-year Treasury with Kroll's premium, the 10-year with Damodaran's.
- What happens to WACC if interest rates rise one point? The risk-free rate in the cost of equity rises one point and the cost of debt rises roughly as much, so WACC rises about one point unless the equity risk premium falls. Damodaran's implied premium fell from 4.25% to 3.79% between February and November 2026 as yields rose, which offset part of the move.
- Does a higher tax rate raise or lower WACC? It lowers it, through a larger tax shield on debt, though it also lowers the cash flows being discounted.
- How would you calculate WACC for a private company? Relever peer betas at a target structure from peers, take the cost of debt from a recent loan or a synthetic rating, add size and company-specific premiums only with evidence, and use target weights.
- Should a buyout fund discount at its target internal rate of return? No. The target return is a levered equity return; the WACC prices the operating assets. The LBO model connects them.
Buyout interviews add an LBO modeling test, where the WACC rarely appears but the same logic about leverage and required returns does. Analyst and associate roles where WACC and DCF work is routine are listed on Private Equity Jobs, and the firms behind them in the companies directory.
WACC FAQs
What is a good WACC?
There is no single good number; a WACC should match the risk of the cash flows. Lower means cheaper capital, which usually reflects a larger, steadier company. In February 2026, the Mister Car Wash banks put a $2bn consumer-services company at about 9.7% to 11.6%; Marshall & Stevens put FONAR, a micro-cap, at 14.5%. For reference, Damodaran's implied expected return on the S&P 500 at the start of November 2026 was 8.73%, a cost of equity for a stock with a beta of 1.0. Damodaran's industry table, with data as of January 2026, puts the average US company outside financial services at 7.72%, from 4.36% for general utilities to 10.55% for semiconductors and 10.66% for internet software. It uses his lower implied premium, so its figures sit below most bankers' builds; compare a company with its own industry on the same source.
Is a higher or lower WACC better?
For the company, lower is better, because each dollar of future cash flow is worth more, and more projects clear the hurdle. A company can lower its WACC by borrowing more, up to the point where the cost of debt and the relevered beta start to climb; by borrowing more cheaply, through refinancing or a better credit rating; or by reducing the risk of the business, which lowers its beta. For an analyst, a low figure is not a goal. A WACC pushed down by a mismatched premium or book weights inflates every value it touches.
What is the difference between WACC and the cost of capital?
Cost of capital is the general term for the return investors require. WACC is the specific blended figure for a whole company with debt and equity. The cost of equity is one of its inputs, and a project or division can have its own cost of capital that differs from the company's WACC. The required rate of return is the same idea from the investor's side: the minimum return an investor will accept, which for the company as a whole is the WACC and for its shares is the cost of equity.
How do you calculate WACC in Excel?
Put each input in its own cell (market value of equity, debt, cost of equity, pre-tax cost of debt, tax rate), then compute =E/(D+E)Re + D/(D+E)Rd(1-t). The cost of equity cell is =Rf + betaERP + premiums. Beta can be estimated with =SLOPE(stock returns, index returns) on weekly or monthly returns, then adjusted and unlevered. A two-way data table on beta and debt-to-equity reproduces the sensitivity grid bankers show.
How often should WACC be updated?
Whenever its inputs move materially: Treasury yields, the equity risk premium, credit spreads or the capital structure. For a deal or a fair value mark, it is set as of the valuation date. Between February and November 2026 the 20-year Treasury moved 0.88 points, enough to change a WACC by most of a point. In the AFP survey, 32% of organizations updated their WACC as needed and 28% once a year.
Sources
Mister Car Wash, Inc., Schedule 13E-3 filed April 3, 2026: Exhibit (c)(3), Centerview Partners discussion materials, February 17, 2026 (Illustrative Mister Car Wash Cost of Capital Calculation; Discounted Cash Flow Analysis), and Exhibit (c)(6), BofA Securities discussion materials, February 17, 2026 (Weighted Average Cost of Capital Range); information statement (DEFM14C), filed April 24, 2026. FONAR Corporation, definitive proxy statement (DEFM14A), filed April 16, 2026: Opinion of Marshall & Stevens. Association for Financial Professionals, 2026 AFP Cost of Capital Survey Report press release, March 10, 2026. Kroll, Kroll Cost of Capital Recommendations Updated to Use Spot Risk-Free Rates, September 10, 2026. Aswath Damodaran, NYU Stern, implied equity risk premium by month (November 2026 update), Country Default Spreads and Risk Premiums (January 5, 2026), Ratings, Interest Coverage Ratios and Default Spread (January 2026) and Cost of Equity and Capital (US) (January 2026). US Department of the Treasury, Daily Treasury Par Yield Curve Rates, 2026. Internal Revenue Service, Fact Sheet 2025-09, Questions and answers about the limitation on the deduction for business interest expense.
Related posts
Related posts
A discounted cash flow analysis values a business at what its future cash is worth today. The formula, the six steps, WACC and terminal value, and a filed 2026 take-private DCF rebuilt line by line.
Comparable company analysis values a business from the multiples of similar listed companies. How to pick peers, build enterprise value, calendarize and apply the range, with a filed 2026 take-private comps table.
A quality of earnings report rebuilds a company's EBITDA, working capital, and net debt before a sale. What it checks, how it differs from an audit, what it costs, and how private equity uses it, with filed deal examples.