
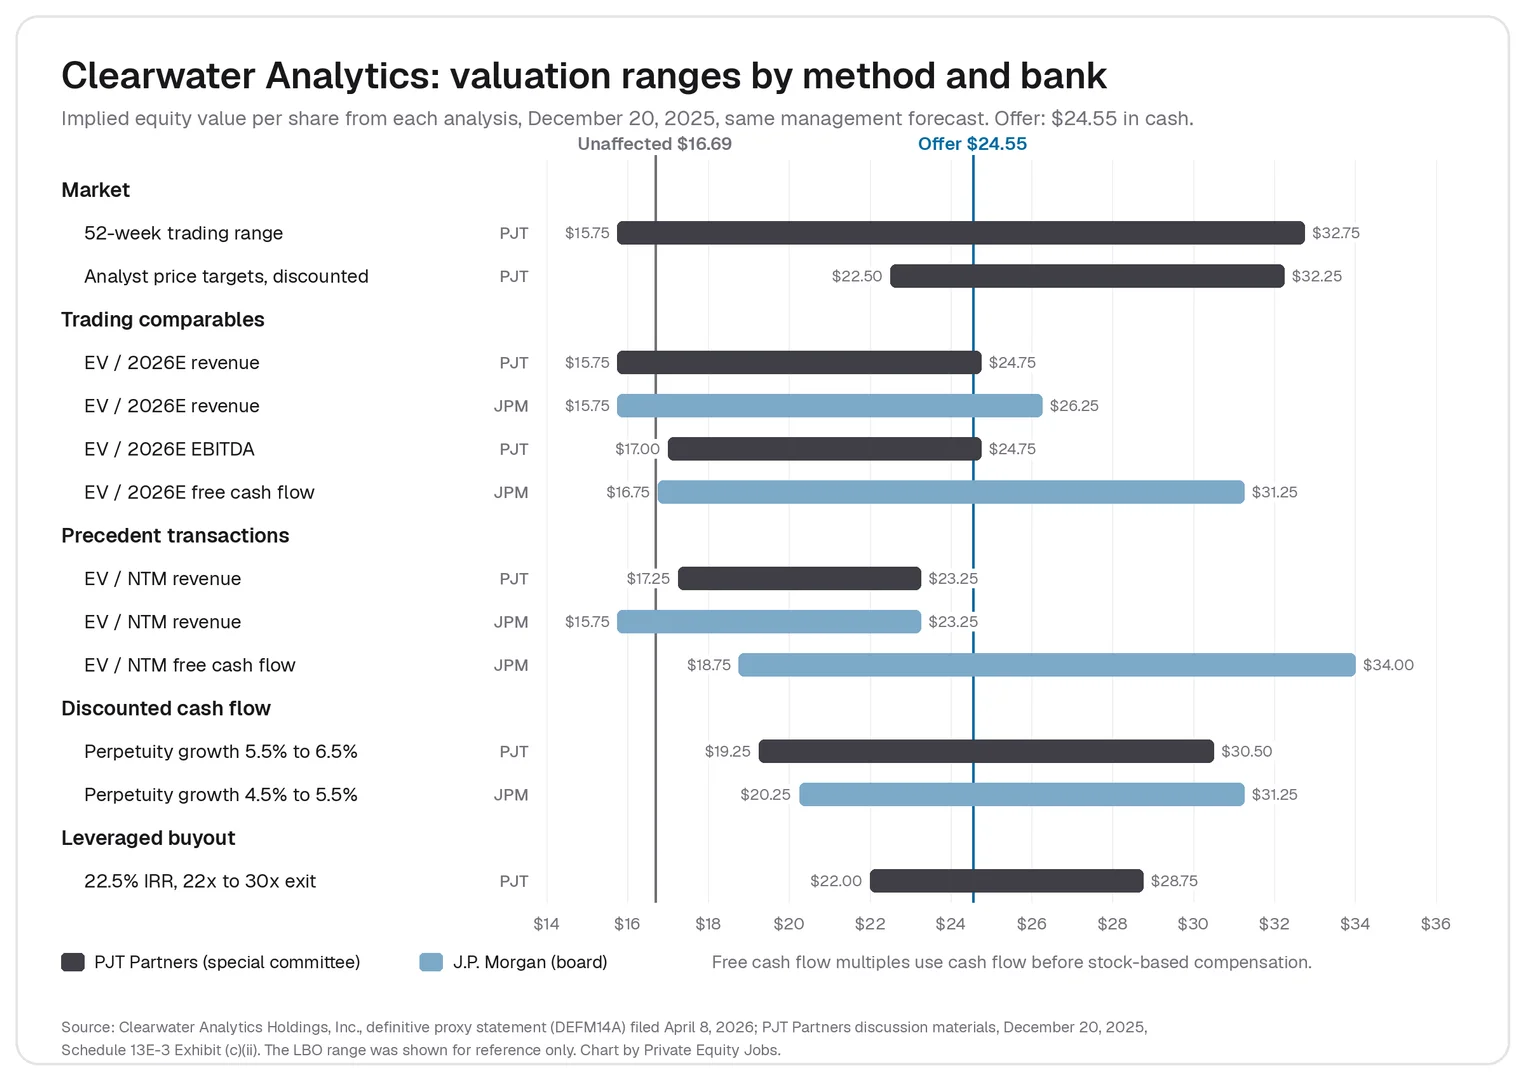
Valuation methods are the techniques used to estimate what a company, or a share of it, is worth. They fall into three approaches. The income approach values the cash a business will generate, the market approach prices it against similar companies and deals, and the asset approach adds up what it owns net of what it owes. In investment banking and private equity, analysts rely mainly on five methods: discounted cash flow analysis, comparable company analysis, precedent transaction analysis, leveraged buyout (LBO) analysis and, for companies with distinct divisions, sum-of-the-parts valuation. Each produces a range rather than a single number, and the ranges rarely agree. When Permira and Warburg Pincus agreed in December 2025 to take Clearwater Analytics private for $24.55 a share, the company's two financial advisers ran every one of these methods on the same management forecast. Their per-share ranges ran from as low as $15.75 to as high as $34.00, and the price sat inside most of them. Revenue-based precedent transactions, which carry a control premium and are usually expected to give the highest value, ended entirely below the offer.
What valuation methods are
A valuation is an estimate of value under stated assumptions. A price is what a buyer and seller actually agree. The two differ because buyers differ. A strategic acquirer may expect cost savings, a financial sponsor needs a target return on borrowed money, and a minority investor in the public market can neither control the company nor sell it all at once. Pablo Fernández of IESE Business School opens his long survey of methods, "Company Valuation Methods. The Most Common Errors in Valuations," with that distinction, and it explains why a valuation always starts with its purpose: who is buying or selling, what interest is being valued and on what date.
Three terms are often used interchangeably, and they mean different things:
- Approach: the broad logic of the valuation (income, market or asset).
- Method: a specific technique within an approach, such as a discounted cash flow (DCF) model within the income approach or trading comparables within the market approach.
- Metric: the figure a method is applied to, such as revenue, earnings before interest, taxes, depreciation and amortization (EBITDA) or free cash flow.
Enterprise value, EBITDA and market capitalization are measures that a method uses or produces. Market capitalization is the market's price for a public company's equity on a given day. It is one input to a valuation, and for a takeover it is the starting point the buyer has to beat.
Most methods first produce enterprise value (EV), the value of the operating business to all its investors, lenders and shareholders together. Equity value per share follows by subtracting debt and other claims, adding cash and dividing by the diluted share count. Cash is added because a buyer of the whole company also acquires its cash and can use it to repay debt, so enterprise value measures the operating business alone. That bridge works the same way whichever method produced the enterprise value, and the same arithmetic underlies a buyout's sources and uses table.
The three valuation approaches
Appraisers, accountants and tax authorities organize methods under the same three headings. The Internal Revenue Service's business valuation guidelines for its own staff, Internal Revenue Manual 4.48.4 (updated 22 September 2020), state the rule in two sentences. "The three generally accepted valuation approaches are the asset-based approach, the market approach and the income approach. Consideration should be given to all three approaches." US fair value accounting under ASC 820 uses the same three, with the asset approach called the cost approach.
| Approach | Question it answers | Main methods | Where it leads |
|---|---|---|---|
| Income | What is the future cash flow worth today? | DCF, capitalization of earnings, dividend discount model, LBO analysis | Companies with forecastable cash flow; the anchor in most merger and acquisition work |
| Market | What do investors pay for similar businesses? | Trading comparables, precedent transactions, market reference points | Public companies and any business with close peers or recent deals |
| Asset (cost) | What are the assets worth, net of liabilities? | Book value, adjusted net assets, liquidation value | Holding companies, asset-heavy or distressed businesses, a floor for small companies |
The income approach is the only one that values the specific company on its own forecast. The market approach is quicker and reflects what people are paying now, but it inherits whatever optimism or pessimism is in those prices. The asset approach ignores the value of a going concern beyond its balance sheet, which for a software company or a services firm is most of the value. In practice, analysts run at least two approaches and look at where they agree.
The main valuation methods
Discounted cash flow
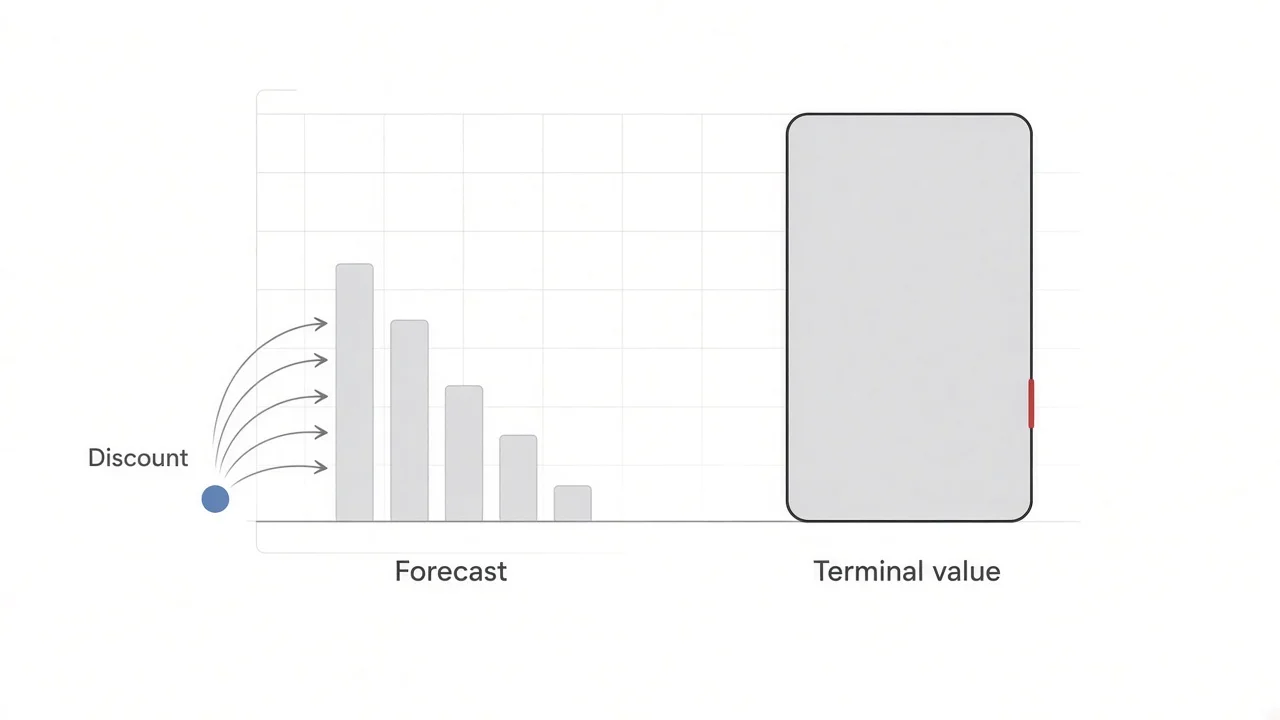
A DCF values a company at the present value of the free cash flow it will generate. Analysts forecast five to ten years of unlevered free cash flow, estimate a terminal value for everything after the forecast, and discount both at the weighted average cost of capital (WACC). The result is enterprise value. The method's strength is that it values the company's own plan rather than the market's mood. Its weakness is that small changes in the discount rate or long-term growth rate move the answer a lot, and the terminal value is usually most of the total. For banks and insurers, where borrowing is part of the business, analysts discount cash flow to equity holders at the cost of equity instead, and the dividend discount model, which values the dividends a company is expected to pay, is the simplest form.
Comparable company analysis
Comparable company analysis, also called trading comps, prices a company off the valuation multiples of similar listed businesses. The analyst picks a peer set, calculates multiples such as enterprise value to revenue or to EBITDA, chooses a range for the target and applies it to the target's own figures. Trading comps reflect current market prices for minority stakes, so they carry no takeover premium. They are only as good as the peer set, and for a company growing faster or slower than its peers the chosen range rests on the analyst's judgment.
Precedent transaction analysis
Precedent transaction analysis applies the multiples paid in past acquisitions of similar companies. Because those prices bought control, precedents include a control premium that trading comps do not. The difficulty is that every deal happened in a different market, at a different point in the interest rate cycle and with its own buyer. A set of software deals struck when debt was cheap and growth stocks were expensive may say little about a company sold in another year.
Leveraged buyout analysis
A leveraged buyout analysis asks what a financial sponsor could pay and still earn its target return. The analyst assumes how much debt the company can carry, an exit multiple and a holding period of about five years, then solves for the entry price that produces a target internal rate of return (IRR), often 20% or more. Bankers call this "ability to pay." It is a buyer-specific method. It says what one class of buyer can afford, which is a different question from what the company is worth.
Sum-of-the-parts valuation
A sum-of-the-parts valuation values each division separately, using whatever method suits it, and adds the pieces together, less corporate costs and net debt. It is used for conglomerates, companies with a listed subsidiary or a business planning a spin-off, where one multiple for the whole would blur very different businesses.
Market reference points
Fairness opinions also show market data that are not valuations in themselves:
- 52-week trading range: where the stock traded over the past year.
- Analyst price targets: research analysts' published targets, often discounted back to today.
- Discounted future share price: a future multiple applied to a future year's earnings, discounted at the cost of equity.
- Premiums paid: the premiums over the undisturbed share price paid in comparable takeovers, applied to the target's own undisturbed price.
These ranges show how the market has priced the stock and what an offer would mean to shareholders, but they do not value the business independently.
Asset-based methods
Book value is shareholders' equity on the balance sheet. Adjusted net asset value restates each asset and liability to market value, which matters for property, investment portfolios and inventory carried at old costs. Liquidation value estimates what the assets would raise in a sale, net of the costs of winding down. Replacement cost, also called the entry cost method, estimates what it would cost to build an equivalent business from scratch by buying the assets, hiring the staff and winning the customers. It works more as a ceiling than as a value, because a buyer can start afresh rather than pay more. These methods lead for holding companies, real estate, financial firms valued on book and businesses that may not survive as going concerns. For a profitable small company, asset value is usually a floor. When a single intangible asset has to be valued, as in the purchase price allocation that follows an acquisition, appraisers use income methods instead, such as relief from royalty for a brand, which values the license fees the owner avoids by owning it, and excess earnings for customer relationships.
How to choose a valuation method
The purpose of the valuation, the company's stage and the data available decide which methods lead. No one method fits every case, and the table below is a guide to which ones usually carry the most weight.
| Situation | Methods that usually lead | Why |
|---|---|---|
| Sale of a public company to a strategic buyer | DCF, trading comps, precedents | The board needs value on its own plan, the market price and what control has cost before |
| Sale to a private equity firm | The above plus LBO analysis | The LBO shows the price a sponsor can afford at its target return |
| Minority investment in a listed stock | Trading comps, DCF | No control is acquired, so no premium belongs in the value |
| Profitable private company with an owner-operator | Capitalization of earnings, market multiples of owner earnings, asset floor | Forecasts are thin and owner pay distorts profit |
| Early-stage company with no profits | Revenue multiples, venture capital method, recent funding rounds | There is no earnings stream to discount reliably |
| Holding company, bank or property business | Adjusted net assets, price to book, sum of the parts | Value sits in the assets or the separate businesses |
| Stock option grants at a private US company (a 409A valuation) | Income and market approaches, recent sales of the stock, asset value | Options priced below fair market value fall under the tax code's deferred compensation rules |
| Business that may be wound down | Liquidation value | The going-concern assumption does not hold |
| Tax, estate or gift reporting | All three approaches, with discounts for lack of marketability and control | Tax guidance asks the appraiser to consider every approach |
Start-ups without revenue sit outside most of these methods. Investors in them use the venture capital method, which takes an expected exit value and discounts it at a high target return, and compare the company with recent funding rounds for similar businesses. The price of a round implies a value: investors who pay $2 million for 20% of a company value it at $10 million after the investment. Angel investors also use rule-based methods, such as the Berkus and scorecard methods, that assign value to the team, the product and the market rather than to cash flow.
A private US company that grants stock options needs the fair market value of its common stock to set the exercise price. The Treasury regulation under Section 409A of the tax code, 26 CFR 1.409A-1, lists the factors a reasonable valuation method considers: tangible and intangible assets, the present value of future cash flows, the value of similar companies, recent arm's length sales of the stock, and control premiums or discounts for lack of marketability. An independent appraisal dated no more than 12 months before the grant is presumed reasonable unless the IRS shows it was grossly unreasonable.
Two further choices sit inside each method. The first is the metric. Revenue multiples are common for software and other high-growth companies whose margins are still rising, EBITDA multiples dominate for mature businesses, and price to earnings or price to book suit banks and insurers. The second is the definition of the metric. Whether EBITDA is measured before or after stock-based compensation (SBC), and whether cash flow includes tax savings from past losses, can change a range by several dollars a share, as the Clearwater example shows.
Valuation methods example: Clearwater Analytics
The deal and the forecast
Clearwater Analytics, a Boise, Idaho, provider of investment accounting and reporting software for institutional investors, agreed on 20 December 2025 to be acquired by a group led by Permira and Warburg Pincus, with Francisco Partners supporting and Temasek participating. Shareholders received $24.55 a share in cash. According to the press release the next day, the transaction was valued at about $8.4 billion, a 47% premium to the undisturbed share price of $16.69 on 10 November 2025, the last trading day before media reports of a sale. The take-private closed on 25 June 2026, when the stock stopped trading on the New York Stock Exchange.
Because Warburg Pincus and Permira were long-standing shareholders with seats on the board, their first proposal, at $24.50 a share on 23 October 2025, was conditioned on approval by a special committee of the board and by a majority of disinterested shareholders. PJT Partners advised the committee and J.P. Morgan advised the board. Both banks valued the company on the same management forecast, and the definitive proxy statement filed on 8 April 2026 summarizes every analysis. PJT's full discussion materials of 20 December 2025 were filed as an exhibit to the Schedule 13E-3 on 24 February 2026. The management forecast both banks used, dated 6 December 2025, is below (E marks an estimate).
| Management forecast ($ millions) | 2025E | 2026E | 2027E | 2028E | 2029E | 2030E |
|---|---|---|---|---|---|---|
| Revenue | 730 | 940 | 1,100 | 1,298 | 1,531 | 1,807 |
| Adjusted EBITDA before stock-based compensation | 248 | 338 | 418 | 518 | 634 | 763 |
| Unlevered free cash flow before stock-based compensation | 300 | 379 | 470 | 576 | 693 | |
| Unlevered free cash flow after stock-based compensation | 173 | 252 | 343 | 449 | 566 |
Revenue grows at about 20% a year from 2025 to 2030 in this plan, and the EBITDA margin rises from 34% to 42%. Stock-based compensation is held at $127 million a year, which is the whole gap between the two free cash flow lines. At $24.55 the equity was worth $7,638 million on 311.1 million diluted shares, and adding $795 million of net debt and other claims gives an enterprise value of $8,433 million, or 9.0 times 2026 revenue and 24.9 times 2026 adjusted EBITDA.
What each method produced
| Method | Bank | Inputs | Value per share |
|---|---|---|---|
| Trading comps, EV/2026E revenue | PJT | 6.0x to 9.0x (11 peers, observed 4.0x to 11.3x) | $15.75 to $24.75 |
| Trading comps, EV/2026E revenue | J.P. Morgan | 6.0x to 9.5x | $15.75 to $26.25 |
| Trading comps, EV/2026E EBITDA | PJT | 18.0x to 25.0x (observed 11.1x to 32.5x) | $17.00 to $24.75 |
| Trading comps, EV/2026E free cash flow before SBC | J.P. Morgan | 20.0x to 35.0x | $16.75 to $31.25 |
| Precedents, EV/next-12-months revenue | PJT | 6.5x to 8.5x (12 deals, observed 3.2x to 9.0x) | $17.25 to $23.25 |
| Precedents, EV/next-12-months revenue | J.P. Morgan | 6.0x to 8.5x | $15.75 to $23.25 |
| Precedents, EV/next-12-months free cash flow before SBC | J.P. Morgan | 22.0x to 38.0x | $18.75 to $34.00 |
| DCF | PJT | WACC 10.0% to 11.0%, perpetuity growth 5.5% to 6.5% | $19.25 to $30.50 |
| DCF | J.P. Morgan | WACC 9.25% to 10.25%, perpetuity growth 4.5% to 5.5% | $20.25 to $31.25 |
| Illustrative LBO (reference only) | PJT | 8.0x debt to 2025E EBITDA, 22.5% IRR, exit at 22x to 30x 2030E EBITDA | $22.00 to $28.75 |
| Discounted future share price (reference) | PJT | 18x to 25x 2027 forward EBITDA, 11.5% cost of equity | $23.00 to $32.25 |
| Discounted analyst targets (reference) | PJT | Published targets | $22.50 to $32.25 |
| 52-week trading range (reference) | PJT | Low and high | $15.75 to $32.75 |
How a multiple becomes a share price
Every market-based range in the table follows the same three steps. Take J.P. Morgan's trading comps on revenue. The top of its range, 9.5 times 2026 revenue of $940 million, gives an enterprise value of $8,930 million. Subtracting $795 million of net debt and other claims leaves $8,135 million of equity, or $26.15 on 311.1 million shares, which the bank rounds to the nearest quarter, $26.25. The bottom of the range works the same way, with one refinement. At lower prices fewer employee options are in the money, so the diluted share count falls to about 309.9 million, and 6.0 times revenue gives $15.75 rather than $15.50. Rebuilt this way, 13 of the 14 multiple-based range ends in the proxy match to the quarter. The other, the top of PJT's EBITDA range, comes out $0.25 lower, which is consistent with rounding in the $338 million EBITDA figure.
Inside the DCF
PJT's discussion materials print the middle of its DCF in full. At a 10.5% WACC and 6.0% perpetuity growth, the five forecast years of free cash flow are worth $1,036 million today. PJT used cash flow after stock-based compensation and excluding tax savings from past losses, a line in the proxy that runs from $134 million in 2026 to $444 million in 2030. The terminal value is worth $6,688 million, which is 87% of the $7,723 million enterprise value. Subtracting $795 million of net debt and adding $447 million for the present value of future cash tax savings gives equity of $7,374 million, or $23.70 a share. That is $0.85 below the offer. At the corners of PJT's grid, 11.0% and 5.5% give $19.25 and 10.0% and 6.5% give $30.50. Moving the discount rate and growth rate by half a point each in both directions moves enterprise value from $6.4 billion to $9.9 billion.
What the Clearwater ranges show
Precedents do not always give the highest value. Precedent transactions are often expected to give the highest range because they include a control premium. At Clearwater, both banks' revenue-based precedent ranges were the lowest on the page and ended at $23.25, below the $24.55 offer. PJT's 12 deals, announced from December 2020 to August 2025, included Thoma Bravo's purchases of RealPage, Coupa Software and Dayforce, Bain Capital's of PowerSchool and Envestnet, and Clearwater's own January 2025 agreement to buy Enfusion. They were done at 3.2 to 9.0 times forward revenue, while Clearwater's own trading peers ranged up to 11.3 times. PJT told the special committee that "a purely quantitative selected precedent transaction analysis would not be particularly meaningful" because the deals took place in different markets and involved companies with different prospects. A control premium lifts precedents above trading comps only when the deals were priced in a market similar to the current one.
The sponsor's ability to pay bracketed the price. PJT's illustrative LBO assumed debt of 8.0 times 2025 adjusted EBITDA, an exit at the end of 2030 at 22 to 30 times EBITDA, and a 22.5% IRR, which PJT's deck shows as about 2.75 times the sponsor's money over five years. It produced $22.00 to $28.75, and $24.55 sits in the lower half. The committed debt financing included a $2.7 billion senior secured term loan, about 8.0 times 2026 adjusted EBITDA. The proxy says the LBO was "referenced solely for informational purposes" and was not part of the analyses behind PJT's opinion. PJT kept it as a reference point because it measures what one type of buyer can afford rather than the value of the company.
The definition of the metric changes the answer. Clearwater's plan includes $127 million a year of stock-based compensation. The offer was 28.1 times 2026 free cash flow measured before that cost, and 48.7 times after it. J.P. Morgan's cash flow multiples, 20 to 35 times, were applied to the larger pre-SBC figure, while both DCFs discounted cash flow after the expense. PJT's LBO assumed stock-based compensation would fall to $32 million a year, 25% of the management forecast, with managers instead receiving a promote of 7.5% of the sponsor's net profits. A range is only comparable to another if both use the same definition of earnings.
A free cash flow multiple implies a DCF. For a company growing at a constant rate, enterprise value divided by next year's free cash flow equals one divided by the gap between the discount rate and the growth rate. J.P. Morgan's 20 to 35 times 2026 free cash flow before stock-based compensation therefore implies a gap of 5.0% to 2.9%. Its own DCF used gaps of 3.75% to 5.75% (a 9.25% to 10.25% WACC less 4.5% to 5.5% growth) on cash flow after the expense. Both forms carry an assumption about risk and growth. The top of the multiple range, 35 times $300 million, is an enterprise value of $10.5 billion. Measured against the $173 million of cash flow left after stock-based compensation, that is 61 times, a gap of 1.6%, well below anything in either bank's DCF.
The two banks chose different DCF inputs. Both worked from the same forecast. PJT's WACC was 0.75 points higher and its perpetuity growth rate a point higher. Both added the value of tax savings from past losses, about $1.41 to $1.46 a share in PJT's case and $1.45 to $1.50 in J.P. Morgan's. Their DCF ranges overlapped by more than $10 a share.
How bankers and appraisers put the methods together
The usual display is a football field chart, with one horizontal bar per method and the offer price or the current share price drawn across all of them. The chart shows where the ranges overlap and where a proposed price sits within them. Bankers do not average the bars into a single number.
Fairness opinions say so. Clearwater's proxy states that PJT "did not attribute any particular weight to any single analysis or factor considered by it, but rather made qualitative judgments as to the significance and relevance of each analysis," and that J.P. Morgan "did not attribute any particular weight to any analyses or factors considered by it and did not form an opinion as to whether any individual analysis or factor (positive or negative), considered in isolation, supported or failed to support its opinion." A fairness opinion answers a narrow question, whether the price is fair, from a financial point of view, to a defined group of shareholders. A price inside the DCF range, near the top of trading comps and above the revenue-based precedents supports that answer without any weighting.
Appraisers valuing a private company for tax, divorce, a partner buyout, litigation or financial reporting work differently. They often weight the approaches explicitly and reach a single conclusion of value, because the assignment requires one number. The IRS guideline refers to "determining and weighing the indications of value," expects the report to show how the conclusion was reached, and asks the appraiser to consider, where not already reflected in the methods, the interest's marketability, its ability to control the business, and any strategic or synergistic value. They draw on the same methods as a fairness opinion, but the assignment calls for a single figure.
Valuing a small or private business
The same approaches apply to a private company owned and run by one person or family, but the methods need adjusting in five ways.
Normalize the earnings first. Owner-managed companies run personal costs, family salaries and one-off items through the accounts. Before any multiple is applied, profit is restated to what a new owner would earn. That restatement, and the work to support it, is what buyers test in a quality of earnings review.
Use the earnings measure buyers use. For small owner-operated businesses, brokers and buyers usually work from seller's discretionary earnings (SDE), which is pre-tax profit plus the owner's salary and benefits, interest, depreciation and amortization, and discretionary or one-time costs. SDE assumes the buyer will run the business personally. Larger companies with a management team are valued on EBITDA, which deducts a market salary for the people running it. Multiples quoted for one measure do not transfer to the other.
Capitalization of earnings is a one-line DCF. Dividing a normalized, sustainable level of earnings or cash flow by a capitalization rate, the discount rate minus long-term growth, gives the income approach for a business with steady results. It is the same arithmetic as a DCF terminal value applied from year one. For example, $500,000 of normalized cash flow at a 20% discount rate and 3% growth is worth $500,000 divided by 17%, or about $2.9 million.
Discounts apply to the interest being valued. A minority stake in a private company is worth less per share than the whole, because its holder cannot set dividends, sell the business or easily find a buyer. Appraisers apply discounts for lack of control and lack of marketability to reach the value of the specific interest. The IRS guideline lists both as factors the appraiser should consider separately if the methods have not already captured them.
Separate the price from the proceeds. Small businesses are often sold on a cash-free, debt-free basis with a normal level of working capital left in the business. The owner's proceeds are the price less any debt repaid at closing, plus or minus any shortfall or excess in working capital, so two offers at the same headline price can leave the seller with different amounts.
A buyer or appraiser will usually ask for three to five years of financial statements and tax returns, a list of owner and one-time expenses, the largest customers' share of revenue, leases, debt agreements and any forecasts. Having those ready shortens the process and supports the earnings adjustments.
Rules of thumb, such as a fixed multiple of revenue for a given industry, are common in small-business sales, but they ignore growth, margins, customer concentration and debt, which is why two companies with the same revenue can sell for different prices. A valuation for a sale, a buyout of a partner or tax reporting is usually prepared by a credentialed appraiser for exactly that reason. Common US credentials are the ASA from the American Society of Appraisers, the ABV from the American Institute of CPAs and the CVA from the National Association of Certified Valuation Analysts. Under the American Institute of CPAs' valuation standard, an appraiser can deliver a full valuation engagement, which reaches a conclusion of value, or a narrower calculation engagement, which applies only the approaches and methods agreed with the client.
Common valuation mistakes
- Mixing enterprise and equity measures. Applying an EV/EBITDA multiple and calling the result equity value, or dividing enterprise value by shares, skips the debt and cash bridge.
- Inconsistent metric definitions. Applying a peer multiple based on EBITDA after stock-based compensation to the target's EBITDA before it, or a pre-SBC cash flow multiple next to a post-SBC DCF without saying so, inflates one range relative to the others.
- Stale or mismatched precedents. Deals from a different interest rate or growth environment are often the wrong benchmark, as PJT told Clearwater's special committee.
- A peer set chosen to fit the answer. Peers should be selected on business model, growth and margins before the multiples are known.
- A terminal value doing all the work unchecked. When terminal value is 84% to 89% of a DCF, as across PJT's Clearwater grid, the implied exit multiple and growth rate deserve as much scrutiny as the forecast.
- A control premium in a minority valuation. Precedent multiples include a premium for control that a minority buyer does not receive.
- Averaging the ranges. A simple average gives equal weight to the 52-week range and the DCF. Each range has to be judged on how well its inputs fit the company.
- Ignoring the purpose. A value for a tax filing, a sale to a strategic buyer and a sponsor's LBO bid can all be correct and still differ.
Valuation methods in interviews
Valuation questions come up in almost every banking and private equity interview. Interviewers look for a clear structure and for judgment about when each method fails.
- "Walk me through the main valuation methods." Name the two approaches used for most companies, intrinsic (DCF) and relative (trading comps and precedent transactions), add LBO analysis for sponsor deals and sum of the parts for conglomerates, give the mechanism of each in a sentence, and say that results are shown as ranges on a football field.
- "Which method gives the highest value?" There is no fixed order. Precedents include a control premium, but if the deals were priced at lower multiples than today's peers they can be lowest, as at Clearwater. A DCF depends on the forecast and the discount rate.
- "When would you not use a DCF?" For companies with unpredictable or negative cash flow and no path to stability, or for banks and insurers, where debt is part of operations and analysts use equity-based methods instead.
- "Why does an LBO analysis often set a floor?" Because a sponsor can usually pay at least that much with available debt, so a strategic buyer has to bid above it to win. In a sponsor deal the LBO range shows what the winning bidder could afford.
- "Why might a DCF and trading comps give different values?" Comps reflect what the market pays today for similar companies, while a DCF reflects the company's own forecast and discount rate. Every multiple carries an implied discount rate and growth rate, so when the market expects faster growth than the forecast shows, comps come out higher.
- "How do you get from enterprise value to share price?" Subtract debt, preferred stock and non-controlling interests, add cash and non-operating assets, and divide by diluted shares calculated with the treasury stock method.
Valuation methods FAQs
What are the three main valuation methods?
The three approaches are the income approach, the market approach and the asset approach. In banking, "the three methods" usually means DCF, trading comparables and precedent transactions.
What are the five methods of valuation?
In corporate finance, the five methods most often listed are DCF, comparable company analysis, precedent transactions, LBO analysis and sum of the parts. Other lists split or group the methods differently, for example by adding capitalization of earnings, book value or liquidation value, so the count depends on the source.
How much is a business worth with $1 million in sales?
Revenue alone does not set a value. Two businesses with $1 million of sales can differ in profit, growth, customer concentration and debt. In BizBuySell's Insight Report for the third quarter of 2026, which draws on closed sales that business brokers report to the marketplace, businesses that sold for less than $1 million went for an average of 0.62 times revenue, and those that sold for more went for 0.97 times. Those averages hide wide differences in profit. Start from normalized earnings, apply a multiple drawn from comparable sales of similar businesses, and check it against a capitalization of earnings and the asset value.
How many times earnings is a business worth?
It depends on growth, risk and the earnings measure used. In BizBuySell's third-quarter 2026 data, businesses sold for less than $1 million went for an average of 2.30 times cash flow, which BizBuySell measures as seller's discretionary earnings, and those sold for more went for 3.73 times. A multiple of SDE for an owner-operated shop and a multiple of EBITDA for a company with a management team are not comparable, and both move with interest rates and buyer demand.
Which valuation method is most accurate?
None is accurate in isolation. A DCF is the most specific to the company but depends on its forecast, and market methods reflect current prices but depend on the peer set. Using several methods and understanding why they differ gives a better answer than any single one.
Do bankers average the valuation methods?
No. Fairness opinions present the ranges side by side and state that no particular weight was given to any analysis. Appraisers preparing a single conclusion of value may weight approaches, and they explain the weights.
Sources
Clearwater Analytics Holdings, Inc., definitive proxy statement (DEFM14A), filed 8 April 2026: Financial Forecasts; Opinion of PJT Partners LP; Opinion of J.P. Morgan Securities LLC. Clearwater Analytics, Schedule 13E-3, filed 24 February 2026: Exhibit (c)(ii), PJT Partners discussion materials, 20 December 2025 (Valuation Summary; Discounted Cash Flow Analysis; Illustrative LBO Analysis), and Exhibit (c)(vi), J.P. Morgan presentation, 20 December 2025. Clearwater Analytics, press release of 21 December 2025 (Exhibit 99.1 to Form 8-K filed 22 December 2025) and Form 8-K filed 25 June 2026 (completion of the merger). Internal Revenue Service, Internal Revenue Manual 4.48.4, Business Valuation Guidelines, 22 September 2020. Pablo Fernández, IESE Business School, "Company Valuation Methods. The Most Common Errors in Valuations", working paper 449, revised February 2007. BizBuySell, Insight Report, third quarter 2026, released 20 October 2026. US Treasury, 26 CFR 1.409A-1, paragraph (b)(5)(iv)(B), Electronic Code of Federal Regulations.
Related posts
Related posts
Terminal value is the value of a company's cash flows after the forecast. Both formulas, how to choose growth and the exit multiple, the cross-checks, and one bank's two filed DCFs of the same company.
WACC is the blended return a company owes its lenders and shareholders. The formula, each input with 2026 data, and two banks' filed WACCs for the same company in the same week, rebuilt line by line.
A discounted cash flow analysis values a business at what its future cash is worth today. The formula, the six steps, WACC and terminal value, and a filed 2026 take-private DCF rebuilt line by line.